Map to Plot Multiple Locations (Step-by-Step Guide)
How to Create a Map to Plot Multiple Locations: A Developer’s Guide
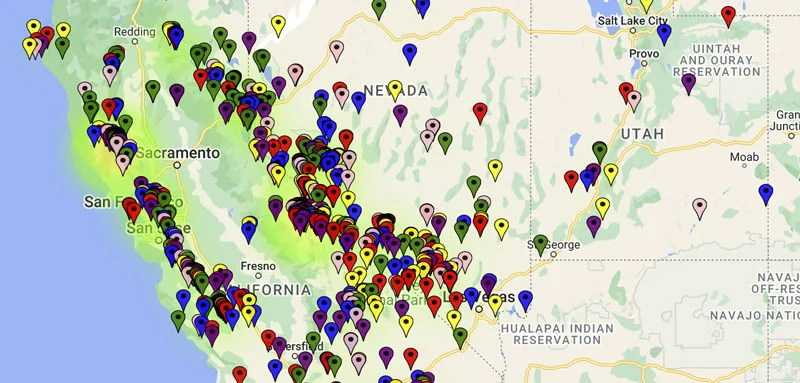
Need to visualize multiple addresses, store locations, or geographic data points on a single map? While Google Maps excels at showing one location, plotting multiple points requires technical expertise. Here’s the working method developers use to create custom multi-location maps.
The Technical Approach: Custom Google Maps Implementation
This method provides maximum flexibility but requires programming skills and Google Cloud setup.
Step 1: Google Cloud Project Setup
- 1. Go to [Google Cloud Console](https://console.cloud.google.com/) and create a new project
- 2. Enable billing (generous free tier available)
- 3. Enable these required APIs:
- – Maps JavaScript API (core mapping)
- – Geocoding API (address conversion)
- – Places API (location search)
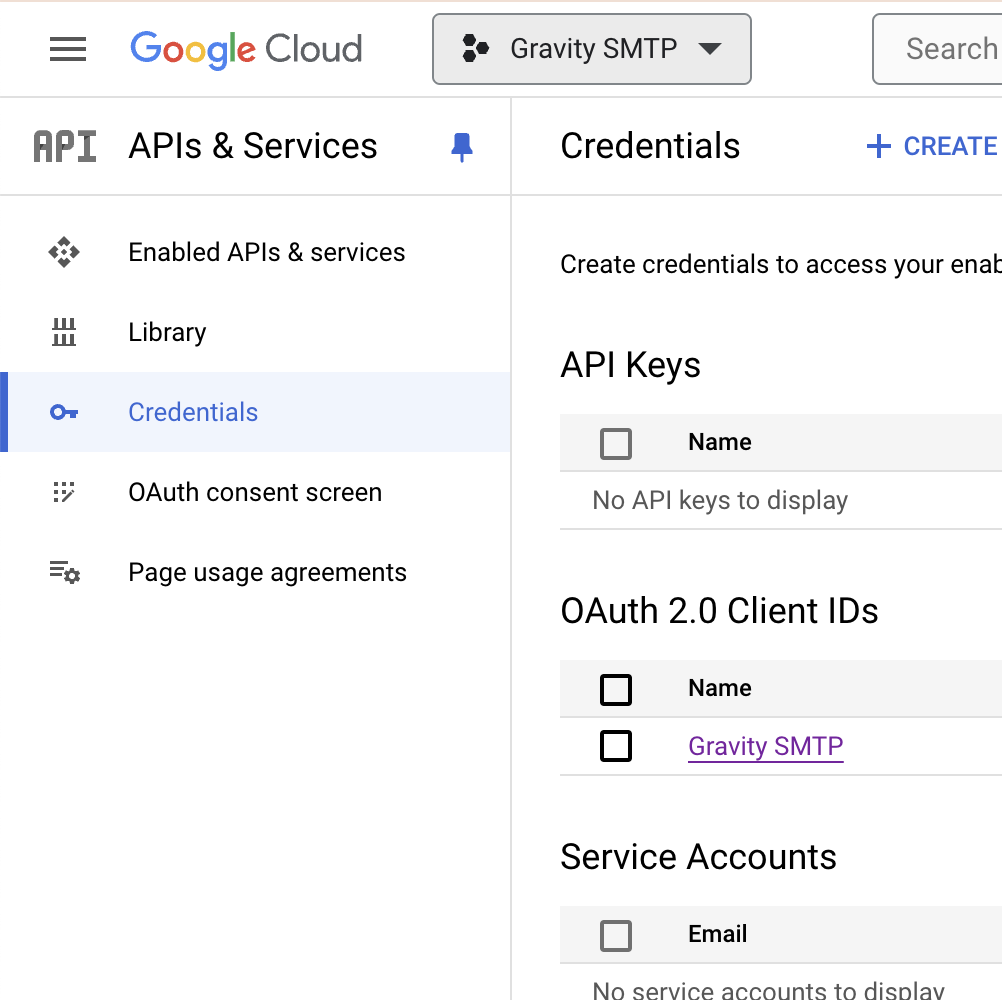
- 1. Navigate to Credentials → Create Credentials → API Key
- 2. Immediately restrict your key:
- – Application: HTTP referrers
- – Domain: `*.yourdomain.com/*`
- – APIs: Only the three listed above
Step 3: Build the Advanced Plotting Map
Create `plot-multiple-locations.html` with this sophisticated code:
html
<!DOCTYPE html>
<html lang="en">
<head>
<meta charset="UTF-8">
<meta name="viewport" content="width=device-width, initial-scale=1.0">
<title>Advanced Multiple Location Plotting Map</title>
<style>
:root {
--primary-color: #4361ee;
--secondary-color: #3a0ca3;
--success-color: #4cc9f0;
--danger-color: #f72585;
--light-bg: #f8f9fa;
--dark-text: #212529;
}
* {
margin: 0;
padding: 0;
box-sizing: border-box;
}
body {
font-family: 'Inter', -apple-system, BlinkMacSystemFont, sans-serif;
background: linear-gradient(135deg, #667eea 0%, #764ba2 100%);
min-height: 100vh;
padding: 20px;
}
.dashboard {
max-width: 1400px;
margin: 0 auto;
background: white;
border-radius: 20px;
overflow: hidden;
box-shadow: 0 20px 60px rgba(0, 0, 0, 0.3);
}
.dashboard-header {
background: linear-gradient(90deg, var(--primary-color), var(--secondary-color));
color: white;
padding: 30px 40px;
}
.header-content {
display: flex;
justify-content: space-between;
align-items: center;
flex-wrap: wrap;
gap: 20px;
}
.header-title h1 {
font-size: 2.8rem;
font-weight: 800;
margin-bottom: 10px;
background: linear-gradient(90deg, #fff, #f8f9fa);
-webkit-background-clip: text;
-webkit-text-fill-color: transparent;
}
.header-title p {
font-size: 1.1rem;
opacity: 0.9;
max-width: 600px;
}
.stats-cards {
display: grid;
grid-template-columns: repeat(4, 1fr);
gap: 20px;
padding: 30px;
background: var(--light-bg);
border-bottom: 1px solid #e9ecef;
}
.stat-card {
background: white;
padding: 25px;
border-radius: 15px;
box-shadow: 0 5px 15px rgba(0, 0, 0, 0.05);
text-align: center;
border-top: 5px solid var(--primary-color);
transition: transform 0.3s;
}
.stat-card:hover {
transform: translateY(-5px);
}
.stat-card h3 {
color: var(--dark-text);
font-size: 2rem;
font-weight: 700;
margin-bottom: 5px;
}
.stat-card p {
color: #6c757d;
font-size: 0.9rem;
text-transform: uppercase;
letter-spacing: 1px;
}
.main-content {
display: grid;
grid-template-columns: 300px 1fr;
min-height: 700px;
}
.sidebar {
background: #f8f9fa;
padding: 30px;
border-right: 1px solid #e9ecef;
}
.section-title {
font-size: 1.2rem;
font-weight: 600;
color: var(--dark-text);
margin-bottom: 20px;
padding-bottom: 10px;
border-bottom: 2px solid var(--primary-color);
}
.input-group {
margin-bottom: 25px;
}
.input-group label {
display: block;
margin-bottom: 8px;
font-weight: 500;
color: var(--dark-text);
}
.input-group input,
.input-group textarea,
.input-group select {
width: 100%;
padding: 12px 15px;
border: 2px solid #e0e0e0;
border-radius: 10px;
font-size: 1rem;
transition: border-color 0.3s;
}
.input-group input:focus,
.input-group textarea:focus,
.input-group select:focus {
outline: none;
border-color: var(--primary-color);
}
.btn {
padding: 14px 28px;
border: none;
border-radius: 10px;
font-weight: 600;
font-size: 1rem;
cursor: pointer;
transition: all 0.3s;
display: inline-flex;
align-items: center;
justify-content: center;
gap: 10px;
}
.btn-primary {
background: var(--primary-color);
color: white;
}
.btn-primary:hover {
background: var(--secondary-color);
transform: translateY(-2px);
box-shadow: 0 5px 15px rgba(67, 97, 238, 0.3);
}
.btn-secondary {
background: #6c757d;
color: white;
}
.btn-success {
background: #2ecc71;
color: white;
}
.btn-danger {
background: var(--danger-color);
color: white;
}
.btn-full {
width: 100%;
margin-top: 10px;
}
.map-container {
position: relative;
padding: 20px;
}
#map {
height: 650px;
border-radius: 15px;
box-shadow: 0 10px 30px rgba(0, 0, 0, 0.1);
}
.locations-list {
max-height: 400px;
overflow-y: auto;
margin-top: 30px;
padding-right: 10px;
}
.location-item {
background: white;
padding: 15px;
border-radius: 10px;
margin-bottom: 10px;
border-left: 4px solid var(--primary-color);
display: flex;
justify-content: space-between;
align-items: center;
box-shadow: 0 3px 10px rgba(0, 0, 0, 0.05);
}
.location-info h4 {
color: var(--dark-text);
margin-bottom: 5px;
}
.location-info p {
color: #6c757d;
font-size: 0.9rem;
}
.location-actions {
display: flex;
gap: 8px;
}
.action-btn {
width: 36px;
height: 36px;
border-radius: 50%;
border: none;
cursor: pointer;
display: flex;
align-items: center;
justify-content: center;
transition: all 0.3s;
}
.action-btn:hover {
transform: scale(1.1);
}
.btn-zoom {
background: var(--success-color);
color: white;
}
.btn-remove {
background: var(--danger-color);
color: white;
}
.cluster-info {
position: absolute;
top: 40px;
right: 40px;
background: white;
padding: 20px;
border-radius: 10px;
box-shadow: 0 5px 20px rgba(0, 0, 0, 0.1);
z-index: 1000;
max-width: 300px;
}
.cluster-info h4 {
color: var(--dark-text);
margin-bottom: 10px;
}
@media (max-width: 1024px) {
.main-content {
grid-template-columns: 1fr;
}
.sidebar {
border-right: none;
border-bottom: 1px solid #e9ecef;
}
.stats-cards {
grid-template-columns: repeat(2, 1fr);
}
}
@media (max-width: 768px) {
.stats-cards {
grid-template-columns: 1fr;
}
.header-content {
flex-direction: column;
text-align: center;
}
}
</style>
<link rel="stylesheet" href="https://cdnjs.cloudflare.com/ajax/libs/font-awesome/6.4.0/css/all.min.css">
</head>
<body>
<div class="dashboard">
<div class="dashboard-header">
<div class="header-content">
<div class="header-title">
<h1><i class="fas fa-map-marked-alt"></i> Advanced Location Plotter</h1>
<p>Visualize and analyze multiple geographic points with precision mapping tools</p>
</div>
<div>
<button id="exportDataBtn" class="btn btn-success">
<i class="fas fa-file-export"></i> Export Data
</button>
<button id="printMapBtn" class="btn btn-secondary">
<i class="fas fa-print"></i> Print Map
</button>
</div>
</div>
</div>
<div class="stats-cards">
<div class="stat-card">
<h3 id="totalLocations">0</h3>
<p>Locations Plotted</p>
</div>
<div class="stat-card">
<h3 id="avgDistance">0</h3>
<p>Avg Distance (mi)</p>
</div>
<div class="stat-card">
<h3 id="clustersFound">0</h3>
<p>Clusters Found</p>
</div>
<div class="stat-card">
<h3 id="coverageArea">0</h3>
<p>Coverage Area (mi²)</p>
</div>
</div>
<div class="main-content">
<div class="sidebar">
<div class="input-group">
<h3 class="section-title"><i class="fas fa-plus-circle"></i> Add New Location</h3>
<label for="locationName"><i class="fas fa-tag"></i> Location Name</label>
<input type="text" id="locationName" placeholder="Enter location name">
<label for="locationAddress"><i class="fas fa-map-marker-alt"></i> Address or Coordinates</label>
<input type="text" id="locationAddress" placeholder="Address or lat,lng">
<label for="locationType"><i class="fas fa-filter"></i> Location Type</label>
<select id="locationType">
<option value="store">Store</option>
<option value="office">Office</option>
<option value="warehouse">Warehouse</option>
<option value="event">Event</option>
<option value="residence">Residence</option>
<option value="landmark">Landmark</option>
</select>
<label for="locationNotes"><i class="fas fa-sticky-note"></i> Notes</label>
<textarea id="locationNotes" rows="3" placeholder="Additional information"></textarea>
<button id="addLocationBtn" class="btn btn-primary btn-full">
<i class="fas fa-map-pin"></i> Plot This Location
</button>
</div>
<div class="input-group">
<h3 class="section-title"><i class="fas fa-tools"></i> Map Controls</h3>
<div style="display: grid; grid-template-columns: 1fr 1fr; gap: 10px;">
<button id="fitBoundsBtn" class="btn btn-secondary">
<i class="fas fa-expand"></i> Fit All
</button>
<button id="clearMapBtn" class="btn btn-danger">
<i class="fas fa-trash"></i> Clear All
</button>
</div>
<label style="margin-top: 20px;"><i class="fas fa-palette"></i> Map Style</label>
<select id="mapStyle">
<option value="standard">Standard</option>
<option value="satellite">Satellite</option>
<option value="terrain">Terrain</option>
<option value="dark">Dark Mode</option>
<option value="light">Light Mode</option>
</select>
<label style="margin-top: 20px;"><i class="fas fa-layer-group"></i> Clustering</label>
<select id="clusteringLevel">
<option value="auto">Auto</option>
<option value="high">High Density</option>
<option value="medium">Medium Density</option>
<option value="low">Low Density</option>
<option value="off">Off</option>
</select>
</div>
<div class="locations-list">
<h3 class="section-title"><i class="fas fa-list-ul"></i> Plotted Locations</h3>
<div id="locationsContainer">
<!-- Locations will be added here dynamically -->
<div style="text-align: center; padding: 40px 20px; color: #6c757d;">
<i class="fas fa-map-pin" style="font-size: 3rem; opacity: 0.3; margin-bottom: 15px;"></i>
<p>No locations plotted yet.<br>Add your first location above.</p>
</div>
</div>
</div>
</div>
<div class="map-container">
<div id="map"></div>
<div class="cluster-info" id="clusterInfo" style="display: none;">
<h4><i class="fas fa-object-group"></i> Cluster Detected</h4>
<p id="clusterDetails">Loading cluster information...</p>
</div>
</div>
</div>
</div>
<!-- Load Google Maps API with MarkerClusterer -->
<script src="https://maps.googleapis.com/maps/api/js?key=YOUR_API_KEY_HERE&libraries=places,geometry&callback=initMap" async defer></script>
<script src="https://unpkg.com/@googlemaps/markerclusterer/dist/index.min.js"></script>
<script>
// Configuration
let map;
let markers = [];
let markerCluster;
let locations = [];
let geocoder;
let infoWindow;
// Map styles
const mapStyles = {
standard: [],
satellite: [
{ featureType: "all", elementType: "labels", stylers: [{ visibility: "off" }] }
],
terrain: [
{ featureType: "administrative", elementType: "labels", stylers: [{ visibility: "off" }] }
],
dark: [
{ elementType: "geometry", stylers: [{ color: "#242f3e" }] },
{ elementType: "labels.text.stroke", stylers: [{ color: "#242f3e" }] },
{ elementType: "labels.text.fill", stylers: [{ color: "#746855" }] }
],
light: [
{ elementType: "geometry", stylers: [{ color: "#f5f5f5" }] },
{ elementType: "labels.text.fill", stylers: [{ color: "#616161" }] }
]
};
// Color scheme by type
const typeColors = {
store: '#e74c3c',
office: '#3498db',
warehouse: '#f39c12',
event: '#9b59b6',
residence: '#2ecc71',
landmark: '#1abc9c'
};
// Initialize the map
function initMap() {
// Default center (North America)
const defaultCenter = { lat: 39.8283, lng: -98.5795 };
// Initialize map
map = new google.maps.Map(document.getElementById("map"), {
center: defaultCenter,
zoom: 4,
mapTypeControl: true,
streetViewControl: true,
fullscreenControl: true,
mapTypeControlOptions: {
style: google.maps.MapTypeControlStyle.DROPDOWN_MENU,
position: google.maps.ControlPosition.TOP_RIGHT
}
});
// Initialize services
geocoder = new google.maps.Geocoder();
infoWindow = new google.maps.InfoWindow();
// Initialize MarkerClusterer
markerCluster = new markerClusterer.MarkerClusterer({ map });
// Setup event listeners
setupEventListeners();
// Load sample data
loadSampleData();
}
function setupEventListeners() {
// Add location button
document.getElementById('addLocationBtn').addEventListener('click', addLocationFromForm);
// Map controls
document.getElementById('fitBoundsBtn').addEventListener('click', fitMapToBounds);
document.getElementById('clearMapBtn').addEventListener('click', clearAllLocations);
// Export and print
document.getElementById('exportDataBtn').addEventListener('click', exportData);
document.getElementById('printMapBtn').addEventListener('click', printMap);
// Style and clustering controls
document.getElementById('mapStyle').addEventListener('change', updateMapStyle);
document.getElementById('clusteringLevel').addEventListener('change', updateClustering);
// Allow Enter key in address field
document.getElementById('locationAddress').addEventListener('keypress', (e) => {
if (e.key === 'Enter') addLocationFromForm();
});
}
function addLocationFromForm() {
const name = document.getElementById('locationName').value.trim();
const address = document.getElementById('locationAddress').value.trim();
const type = document.getElementById('locationType').value;
const notes = document.getElementById('locationNotes').value.trim();
if (!name || !address) {
alert('Please provide both a name and address/coordinates.');
return;
}
// Check if input is coordinates
const coordMatch = address.match(/(-?\d+\.?\d*),\s*(-?\d+\.?\d*)/);
if (coordMatch) {
// Direct coordinates
const lat = parseFloat(coordMatch[1]);
const lng = parseFloat(coordMatch[2]);
addLocationToMap(lat, lng, name, type, notes);
clearForm();
} else {
// Geocode address
geocoder.geocode({ address: address }, (results, status) => {
if (status === 'OK') {
const lat = results[0].geometry.location.lat();
const lng = results[0].geometry.location.lng();
addLocationToMap(lat, lng, name, type, notes);
clearForm();
} else {
alert('Could not find location. Please try a different address or use coordinates.');
}
});
}
}
function addLocationToMap(lat, lng, name, type, notes) {
const locationId = Date.now();
const locationData = {
id: locationId,
name: name,
lat: lat,
lng: lng,
type: type,
notes: notes,
added: new Date().toISOString()
};
// Create custom marker
const marker = new google.maps.Marker({
position: { lat: lat, lng: lng },
map: map,
title: name,
icon: {
path: google.maps.SymbolPath.CIRCLE,
fillColor: typeColors[type] || '#666',
fillOpacity: 0.9,
strokeWeight: 2,
strokeColor: '#ffffff',
scale: 12
},
animation: google.maps.Animation.DROP
});
// Create info window content
const infoContent = `
<div style="min-width: 250px; padding: 15px; font-family: 'Inter', sans-serif;">
<h3 style="margin: 0 0 10px 0; color: ${typeColors[type] || '#666'};">${name}</h3>
<div style="margin-bottom: 12px;">
<p style="margin: 5px 0; color: #555;">
<strong>Type:</strong> ${type.charAt(0).toUpperCase() + type.slice(1)}<br>
<strong>Coordinates:</strong> ${lat.toFixed(6)}, ${lng.toFixed(6)}
</p>
${notes ? `<p style="margin: 10px 0; padding: 10px; background: #f8f9fa; border-radius: 5px; color: #666;">${notes}</p>` : ''}
</div>
<div style="display: flex; gap: 10px; margin-top: 15px;">
<button onclick="zoomToLocation(${locationId})"
style="flex: 1; padding: 8px; background: #3498db; color: white; border: none; border-radius: 5px; cursor: pointer;">
Zoom In
</button>
<button onclick="removeLocation(${locationId})"
style="flex: 1; padding: 8px; background: #e74c3c; color: white; border: none; border-radius: 5px; cursor: pointer;">
Remove
</button>
</div>
</div>
`;
// Add click listener to marker
marker.addListener('click', () => {
infoWindow.setContent(infoContent);
infoWindow.open(map, marker);
});
// Store location data
locations.push({
...locationData,
marker: marker
});
// Add marker to cluster
markerCluster.addMarker(marker);
// Update UI
updateLocationsList();
updateStats();
// Recenter map if this is the first location
if (locations.length === 1) {
map.setCenter({ lat: lat, lng: lng });
map.setZoom(10);
}
}
function updateLocationsList() {
const container = document.getElementById('locationsContainer');
if (locations.length === 0) {
container.innerHTML = `
<div style="text-align: center; padding: 40px 20px; color: #6c757d;">
<i class="fas fa-map-pin" style="font-size: 3rem; opacity: 0.3; margin-bottom: 15px;"></i>
<p>No locations plotted yet.<br>Add your first location above.</p>
</div>
`;
return;
}
let html = '';
locations.forEach((loc, index) => {
html += `
<div class="location-item">
<div class="location-info">
<h4><i class="fas fa-map-pin" style="color: ${typeColors[loc.type] || '#666'}"></i> ${loc.name}</h4>
<p>${loc.lat.toFixed(4)}, ${loc.lng.toFixed(4)} • ${loc.type}</p>
</div>
<div class="location-actions">
<button onclick="zoomToLocation(${loc.id})" class="action-btn btn-zoom" title="Zoom to location">
<i class="fas fa-search-plus"></i>
</button>
<button onclick="removeLocation(${loc.id})" class="action-btn btn-remove" title="Remove location">
<i class="fas fa-times"></i>
</button>
</div>
</div>
`;
});
container.innerHTML = html;
}
function updateStats() {
document.getElementById('totalLocations').textContent = locations.length;
// Calculate average distance if we have at least 2 locations
if (locations.length >= 2) {
let totalDistance = 0;
let pairCount = 0;
for (let i = 0; i < locations.length; i++) {
for (let j = i + 1; j < locations.length; j++) {
const distance = calculateDistance(
locations[i].lat, locations[i].lng,
locations[j].lat, locations[j].lng
);
totalDistance += distance;
pairCount++;
}
}
const avgDistance = pairCount > 0 ? (totalDistance / pairCount).toFixed(1) : 0;
document.getElementById('avgDistance').textContent = avgDistance;
// Estimate clusters (simple heuristic)
const clusters = Math.max(1, Math.floor(locations.length / 5));
document.getElementById('clustersFound').textContent = clusters;
// Estimate coverage area
if (locations.length >= 3) {
const bounds = new google.maps.LatLngBounds();
locations.forEach(loc => {
bounds.extend(new google.maps.LatLng(loc.lat, loc.lng));
});
const ne = bounds.getNorthEast();
const sw = bounds.getSouthWest();
const width = calculateDistance(ne.lat(), sw.lng(), ne.lat(), ne.lng());
const height = calculateDistance(ne.lat(), ne.lng(), sw.lat(), ne.lng());
const area = (width * height).toFixed(0);
document.getElementById('coverageArea').textContent = area;
}
}
}
function calculateDistance(lat1, lon1, lat2, lon2) {
const R = 3958.8; // Earth's radius in miles
const dLat = (lat2 - lat1) * Math.PI / 180;
const dLon = (lon2 - lon1) * Math.PI / 180;
const a =
Math.sin(dLat/2) * Math.sin(dLat/2) +
Math.cos(lat1 * Math.PI / 180) * Math.cos(lat2 * Math.PI / 180) *
Math.sin(dLon/2) * Math.sin(dLon/2);
const c = 2 * Math.atan2(Math.sqrt(a), Math.sqrt(1-a));
return R * c;
}
function zoomToLocation(locationId) {
const location = locations.find(loc => loc.id === locationId);
if (location) {
map.setCenter({ lat: location.lat, lng: location.lng });
map.setZoom(15);
infoWindow.close();
}
}
function removeLocation(locationId) {
const index = locations.findIndex(loc => loc.id === locationId);
if (index !== -1) {
locations[index].marker.setMap(null);
markerCluster.removeMarker(locations[index].marker);
locations.splice(index, 1);
updateLocationsList();
updateStats();
}
}
function fitMapToBounds() {
if (locations.length === 0) return;
const bounds = new google.maps.LatLngBounds();
locations.forEach(loc => {
bounds.extend(new google.maps.LatLng(loc.lat, loc.lng));
});
map.fitBounds(bounds);
// Prevent zooming too far out
google.maps.event.addListenerOnce(map, 'bounds_changed', function() {
if (this.getZoom() > 15) {
this.setZoom(15);
}
});
}
function clearAllLocations() {
if (locations.length === 0) return;
if (confirm(`Are you sure you want to remove all ${locations.length} locations?`)) {
locations.forEach(loc => {
loc.marker.setMap(null);
});
markerCluster.clearMarkers();
locations = [];
updateLocationsList();
updateStats();
}
}
function updateMapStyle() {
const style = document.getElementById('mapStyle').value;
map.setOptions({ styles: mapStyles[style] });
}
function updateClustering() {
const level = document.getElementById('clusteringLevel').value;
// In a real implementation, you would adjust MarkerClusterer options here
console.log(`Clustering level changed to: ${level}`);
}
function exportData() {
if (locations.length === 0) {
alert('No locations to export.');
return;
}
const exportData = locations.map(loc => ({
name: loc.name,
latitude: loc.lat,
longitude: loc.lng,
type: loc.type,
notes: loc.notes,
added: loc.added
}));
const dataStr = JSON.stringify(exportData, null, 2);
const dataUri = 'data:application/json;charset=utf-8,' + encodeURIComponent(dataStr);
const linkElement = document.createElement('a');
linkElement.setAttribute('href', dataUri);
linkElement.setAttribute('download', `locations-export-${new Date().toISOString().slice(0,10)}.json`);
document.body.appendChild(linkElement);
linkElement.click();
document.body.removeChild(linkElement);
}
function printMap() {
window.print();
}
function clearForm() {
document.getElementById('locationName').value = '';
document.getElementById('locationAddress').value = '';
document.getElementById('locationNotes').value = '';
document.getElementById('locationName').focus();
}
function loadSampleData() {
// Add a few sample locations to demonstrate
const sampleData = [
{ name: "New York Office", lat: 40.7128, lng: -74.0060, type: "office" },
{ name: "Los Angeles Store", lat: 34.0522, lng: -118.2437, type: "store" },
{ name: "Chicago Warehouse", lat: 41.8781, lng: -87.6298, type: "warehouse" },
{ name: "Miami Event Space", lat: 25.7617, lng: -80.1918, type: "event" },
{ name: "Seattle HQ", lat: 47.6062, lng: -122.3321, type: "office" }
];
// Add samples after a short delay
setTimeout(() => {
sampleData.forEach((item, index) => {
setTimeout(() => {
addLocationToMap(item.lat, item.lng, item.name, item.type, "Sample location for demonstration");
}, index * 300);
});
}, 1000);
}
// Make functions available globally
window.zoomToLocation = zoomToLocation;
window.removeLocation = removeLocation;
</script>
</body>
</html>
Code language: HTML, XML (xml)Step 4: Deploy and Use Your Map
- 1. Replace API Key: Change `YOUR_API_KEY_HERE` to your actual Google Maps API key
- 2. Test Locally: Open in browser to test functionality
- 3. Upload to Server: Deploy to your web hosting
- 4. Embed Anywhere: Use iframe or integrate directly into your site
The Hidden Complexity of This Solution
While technically impressive, this approach has significant drawbacks:
- 1. API Management Overhead: Constant monitoring of usage and costs
- 2. No Built-in Data Import: Can’t easily import CSV or spreadsheet data
- 3. Complex Deployment: Requires web hosting and file management
- 4. No Collaboration Features: Only one person can edit at a time
- 5. Limited Analytics: Basic stats require custom coding
- 6. Mobile Responsiveness Challenges: Complex interface may not work well on phones
- 7. No Automatic Updates: Locations database doesn’t sync across devices
The Professional Alternative: MapsFun.com
Why spend days building a plotting tool when you can have a better solution instantly?
MapsFun.com provides all the advanced features of the custom solution—plus enterprise capabilities—without any coding:
- ✅ Drag-and-Drop Interface – Plot locations visually in seconds
- ✅ CSV/Excel Import – Upload thousands of locations at once
- ✅ Advanced Analytics – Built-in heatmaps, density analysis, and route optimization
- ✅ Real-time Collaboration – Multiple team members can edit simultaneously
- ✅ Automatic Geocoding – Converts addresses to coordinates instantly
- ✅ Professional Templates – Pre-designed maps for different use cases
- ✅ Cloud Storage – Access your maps from any device
- ✅ One-Click Sharing – Generate public links or private embeds
With MapsFun.com, here’s the workflow:
- 1. Sign up at MapsFun.com (free trial available)
- 2. Upload your spreadsheet or add locations manually
- 3. Customize with professional design tools
- 4. Share or embed with one click
The custom Google Maps API solution is perfect for developers building specialized applications, but for business analysts, marketers, logistics managers, event planners, or anyone needing to plot multiple locations quickly, it’s unnecessarily complex and time-consuming.
Stop building mapping tools and start using professional ones. Create stunning, interactive maps to plot multiple locations in minutes at MapsFun.com – the complete no-code mapping platform.