How to Plot Several Points on a Map (Tutorial)
How to Plot Several Points on a Map: Complete Technical Guide
Visualizing multiple locations on a map is essential for businesses showing store networks, service areas, or event locations. While possible to build custom mapping solutions, the process requires significant technical expertise. Here’s your comprehensive guide to plotting multiple points using Google Maps API
Method 1: Custom Implementation with Google Maps API
Step 1: Google Cloud Project Setup
Before any development, configure Google’s mapping services:
- 1. Create Google Cloud Project
- – Access [Google Cloud Console](https://console.cloud.google.com/)
- – Create new project or select existing
- – Enable billing (credit card required, includes $200 monthly credit)
- 2. Enable Required APIs
- Navigate to “APIs & Services > Library” and enable:
- – Maps JavaScript API (core mapping functionality)
- – Geocoding API (address to coordinates conversion)
- – Places API (for location search)
- 3. Generate Secure API Key
- – Create credentials > API Key
- – Restrict by HTTP referrers (your domain)
- – Apply API restrictions to specific mapping services
Step 2: Complete HTML/JavaScript Implementation
Create `plot-points-map.html` with this fully functional code:
html
<!DOCTYPE html>
<html>
<head>
<title>Plot Multiple Points on Map</title>
<meta name="viewport" content="width=device-width, initial-scale=1.0">
<style>
.mapping-container {
max-width: 1200px;
margin: 0 auto;
font-family: 'Segoe UI', Tahoma, Geneva, Verdana, sans-serif;
padding: 20px;
}
#map-canvas {
height: 650px;
width: 100%;
border-radius: 10px;
border: 2px solid #e0e0e0;
margin: 25px 0;
box-shadow: 0 4px 15px rgba(0,0,0,0.1);
}
.control-panel {
background: linear-gradient(135deg, #667eea 0%, #764ba2 100%);
color: white;
padding: 25px;
border-radius: 10px;
margin: 20px 0;
}
.point-card {
background: white;
border-radius: 8px;
padding: 18px;
margin: 12px 0;
border-left: 5px solid #667eea;
box-shadow: 0 3px 10px rgba(0,0,0,0.08);
transition: transform 0.2s ease;
}
.point-card:hover {
transform: translateY(-2px);
}
.input-field {
padding: 14px;
width: 320px;
border: none;
border-radius: 6px;
font-size: 16px;
margin-right: 12px;
box-shadow: 0 2px 5px rgba(0,0,0,0.1);
}
.primary-btn {
padding: 14px 28px;
background: #ff6b6b;
color: white;
border: none;
border-radius: 6px;
cursor: pointer;
font-size: 16px;
font-weight: 600;
margin: 0 5px;
transition: background 0.3s ease;
}
.primary-btn:hover {
background: #ee5a5a;
}
.secondary-btn {
padding: 10px 20px;
background: #4ecdc4;
color: white;
border: none;
border-radius: 5px;
cursor: pointer;
margin: 0 3px;
}
.coordinates {
font-family: 'Courier New', monospace;
background: #f8f9fa;
padding: 8px 12px;
border-radius: 4px;
font-size: 14px;
}
</style>
</head>
<body>
<div class="mapping-container">
<h1 style="text-align: center; color: #333; margin-bottom: 10px;">Plot Multiple Points on Interactive Map</h1>
<p style="text-align: center; color: #666; margin-bottom: 30px;">Visualize your locations with custom markers and detailed information</p>
<div class="control-panel">
<h3 style="margin-top: 0;">📍 Add Map Points</h3>
<div style="display: flex; align-items: center; flex-wrap: wrap; gap: 15px;">
<input type="text" id="point-address" class="input-field"
placeholder="Enter address or place name...">
<input type="text" id="point-name" class="input-field"
placeholder="Point name (optional)" style="width: 200px;">
<button onclick="addPointFromAddress()" class="primary-btn">Add Point</button>
<button onclick="clearAllPoints()" class="primary-btn" style="background: #45b7d1;">Clear All</button>
<button onclick="exportPointsData()" class="primary-btn" style="background: #96ceb4;">Export Data</button>
</div>
<div style="margin-top: 15px; display: flex; gap: 20px; flex-wrap: wrap;">
<label style="display: flex; align-items: center;">
<input type="checkbox" id="show-clusters" checked style="margin-right: 8px;">
Enable marker clustering
</label>
<label style="display: flex; align-items: center;">
<input type="checkbox" id="auto-fit" checked style="margin-right: 8px;">
Auto-fit map to points
</label>
</div>
</div>
<div id="map-canvas"></div>
<div style="background: white; padding: 25px; border-radius: 10px; box-shadow: 0 3px 15px rgba(0,0,0,0.1);">
<h3 style="color: #333; margin-bottom: 20px;">
Plotted Points
<span id="points-counter" style="background: #667eea; color: white; padding: 4px 12px; border-radius: 20px; font-size: 14px; margin-left: 10px;">0 points</span>
</h3>
<div id="points-list-container"></div>
</div>
</div>
<!-- Load Google Maps API with Places library -->
<script src="https://maps.googleapis.com/maps/api/js?key=YOUR_API_KEY_HERE&libraries=places,geometry&callback=initializeMapping" async defer></script>
<script>
let map;
let markers = [];
let geocoder;
let infoWindow;
let plottedPoints = [];
let placesAutocomplete;
function initializeMapping() {
// Initialize map with custom styling
map = new google.maps.Map(document.getElementById('map-canvas'), {
center: { lat: 39.8283, lng: -98.5795 }, // Center of US
zoom: 4,
styles: [
{
"featureType": "water",
"stylers": [{ "color": "#e9f5f9" }]
},
{
"featureType": "landscape",
"stylers": [{ "color": "#f5f5f5" }]
},
{
"featureType": "road",
"stylers": [{ "color": "#ffffff" }, { "visibility": "on" }]
}
],
mapTypeControl: true,
streetViewControl: false,
fullscreenControl: true
});
geocoder = new google.maps.Geocoder();
infoWindow = new google.maps.InfoWindow();
// Initialize autocomplete for address input
const addressInput = document.getElementById('point-address');
placesAutocomplete = new google.maps.places.Autocomplete(addressInput);
placesAutocomplete.bindTo('bounds', map);
// Add sample data points
const samplePoints = [
{
id: 1,
name: "Central Office",
position: { lat: 40.7128, lng: -74.0060 },
address: "Manhattan, New York, NY",
category: "office",
description: "Main headquarters with customer service"
},
{
id: 2,
name: "Distribution Center",
position: { lat: 41.8781, lng: -87.6298 },
address: "Chicago, Illinois",
category: "warehouse",
description: "Primary distribution and logistics hub"
},
{
id: 3,
name: "Retail Store West",
position: { lat: 34.0522, lng: -118.2437 },
address: "Los Angeles, California",
category: "retail",
description: "Flagship retail location with showroom"
},
{
id: 4,
name: "Regional Office South",
position: { lat: 32.7767, lng: -96.7970 },
address: "Dallas, Texas",
category: "office",
description: "Southern regional management office"
}
];
// Plot sample points
samplePoints.forEach(point => {
plotSinglePoint(point);
});
updatePointsDisplay();
}
function plotSinglePoint(pointData) {
const markerColor = getMarkerColor(pointData.category);
const marker = new google.maps.Marker({
position: pointData.position,
map: map,
title: pointData.name,
icon: {
path: google.maps.SymbolPath.CIRCLE,
fillColor: markerColor,
fillOpacity: 1,
strokeColor: '#ffffff',
strokeWeight: 2,
scale: 10
},
animation: google.maps.Animation.DROP
});
// Create enhanced info window
const infoContent = `
<div style="padding: 20px; min-width: 280px; font-family: Arial, sans-serif;">
<div style="display: flex; align-items: center; margin-bottom: 15px;">
<div style="width: 12px; height: 12px; background: ${markerColor}; border-radius: 50%; margin-right: 10px;"></div>
<h3 style="margin: 0; color: #2c3e50;">${pointData.name}</h3>
</div>
<div style="margin-bottom: 12px;">
<strong style="color: #7f8c8d;">📍 Address:</strong><br>
<span style="color: #34495e;">${pointData.address}</span>
</div>
<div style="margin-bottom: 12px;">
<strong style="color: #7f8c8d;">📊 Category:</strong>
<span style="color: #34495e; text-transform: capitalize; background: #ecf0f1; padding: 2px 8px; border-radius: 12px; font-size: 12px; margin-left: 8px;">
${pointData.category}
</span>
</div>
<div style="margin-bottom: 15px;">
<strong style="color: #7f8c8d;">📝 Description:</strong><br>
<span style="color: #34495e; font-style: italic;">${pointData.description}</span>
</div>
<div style="margin-bottom: 15px; padding: 10px; background: #f8f9fa; border-radius: 6px;">
<strong style="color: #7f8c8d;">🎯 Coordinates:</strong><br>
<span class="coordinates">${pointData.position.lat.toFixed(6)}, ${pointData.position.lng.toFixed(6)}</span>
</div>
<div style="display: flex; gap: 10px;">
<button onclick="focusOnThisPoint(${pointData.position.lat}, ${pointData.position.lng})"
style="flex: 1; padding: 10px; background: #3498db; color: white; border: none; border-radius: 5px; cursor: pointer;">
🔍 Focus
</button>
<button onclick="getDirectionsToPoint(${pointData.position.lat}, ${pointData.position.lng})"
style="flex: 1; padding: 10px; background: #27ae60; color: white; border: none; border-radius: 5px; cursor: pointer;">
🧭 Directions
</button>
</div>
</div>
`;
marker.addListener('click', () => {
infoWindow.setContent(infoContent);
infoWindow.open(map, marker);
// Add bounce animation
marker.setAnimation(google.maps.Animation.BOUNCE);
setTimeout(() => marker.setAnimation(null), 1400);
});
markers.push(marker);
plottedPoints.push(pointData);
if (document.getElementById('auto-fit').checked) {
adjustMapViewport();
}
}
function getMarkerColor(category) {
const colorMap = {
'office': '#e74c3c',
'warehouse': '#f39c12',
'retail': '#2ecc71',
'distribution': '#9b59b6',
'default': '#3498db'
};
return colorMap[category] || colorMap['default'];
}
function addPointFromAddress() {
const addressInput = document.getElementById('point-address');
const nameInput = document.getElementById('point-name');
const place = placesAutocomplete.getPlace();
if (!place || !place.geometry) {
alert('Please select a valid location from the suggestions');
return;
}
const newPoint = {
id: Date.now(), // Simple unique ID
name: nameInput.value || `Point ${plottedPoints.length + 1}`,
position: place.geometry.location,
address: place.formatted_address,
category: 'office',
description: 'Added via address search'
};
plotSinglePoint(newPoint);
updatePointsDisplay();
// Clear inputs
addressInput.value = '';
nameInput.value = '';
}
function clearAllPoints() {
if (plottedPoints.length === 0) return;
if (!confirm(`Are you sure you want to remove all ${plottedPoints.length} points?`)) {
return;
}
markers.forEach(marker => marker.setMap(null));
markers = [];
plottedPoints = [];
updatePointsDisplay();
}
function updatePointsDisplay() {
const container = document.getElementById('points-list-container');
const counter = document.getElementById('points-counter');
counter.textContent = `${plottedPoints.length} point${plottedPoints.length !== 1 ? 's' : ''}`;
container.innerHTML = '';
if (plottedPoints.length === 0) {
container.innerHTML = `
<div style="text-align: center; padding: 40px; color: #7f8c8d;">
<div style="font-size: 48px; margin-bottom: 10px;">🗺️</div>
<h3 style="color: #95a5a6;">No points plotted yet</h3>
<p>Use the search above to add points to your map</p>
</div>
`;
return;
}
plottedPoints.forEach((point, index) => {
const pointElement = document.createElement('div');
pointElement.className = 'point-card';
pointElement.innerHTML = `
<div style="display: flex; justify-content: between; align-items: flex-start; margin-bottom: 10px;">
<h4 style="margin: 0; color: #2c3e50; flex: 1;">${point.name}</h4>
<span style="background: ${getMarkerColor(point.category)}; color: white; padding: 2px 8px; border-radius: 12px; font-size: 11px; text-transform: uppercase;">
${point.category}
</span>
</div>
<p style="margin: 8px 0; color: #34495e; line-height: 1.4;">${point.address}</p>
<p style="margin: 8px 0; color: #7f8c8d; font-size: 14px;">${point.description}</p>
<div style="display: flex; justify-content: space-between; align-items: center; margin-top: 12px;">
<span class="coordinates">${point.position.lat.toFixed(4)}, ${point.position.lng.toFixed(4)}</span>
<div>
<button onclick="focusOnThisPoint(${point.position.lat}, ${point.position.lng})" class="secondary-btn" style="background: #3498db;">
View
</button>
<button onclick="removeThisPoint(${index})" class="secondary-btn" style="background: #e74c3c;">
Remove
</button>
</div>
</div>
`;
container.appendChild(pointElement);
});
}
function focusOnThisPoint(lat, lng) {
map.setCenter({ lat, lng });
map.setZoom(15);
}
function removeThisPoint(index) {
if (index >= 0 && index < markers.length) {
markers[index].setMap(null);
markers.splice(index, 1);
plottedPoints.splice(index, 1);
updatePointsDisplay();
adjustMapViewport();
}
}
function getDirectionsToPoint(lat, lng) {
const url = `https://www.google.com/maps/dir/?api=1&destination=${lat},${lng}`;
window.open(url, '_blank');
}
function exportPointsData() {
if (plottedPoints.length === 0) {
alert('No points to export');
return;
}
const dataStr = JSON.stringify(plottedPoints, null, 2);
const dataBlob = new Blob([dataStr], { type: 'application/json' });
const url = URL.createObjectURL(dataBlob);
const link = document.createElement('a');
link.href = url;
link.download = 'map-points-export.json';
link.click();
URL.revokeObjectURL(url);
}
function adjustMapViewport() {
if (markers.length === 0) return;
const bounds = new google.maps.LatLngBounds();
markers.forEach(marker => {
bounds.extend(marker.getPosition());
});
map.fitBounds(bounds);
// Prevent excessive zoom for single point
if (markers.length === 1 && map.getZoom() > 15) {
map.setZoom(15);
}
}
// Error handling for API failures
window.gm_authFailure = function() {
alert('Google Maps API Error: Please check your API key configuration and billing setup.');
};
// Handle Enter key in address field
document.getElementById('point-address').addEventListener('keypress', function(e) {
if (e.key === 'Enter') {
addPointFromAddress();
}
});
</script>
</body>
</html>
Code language: HTML, XML (xml)Replace `YOUR_API_KEY_HERE` with your actual Google Maps API key.
Step 3: Implementation Challenges
When deploying this solution, expect to handle:
- – API quota management and usage monitoring
- – Cross-browser compatibility issues
- – Mobile touch interface optimization
- – Geocoding service reliability and error handling
- – Performance optimization for large datasets
- – SSL certificate requirements for modern browsers
The Reality of Custom Map Development
While this approach offers complete customization, it comes with substantial overhead:
- – Development Timeline: 25-40 hours for production-ready implementation
- – API Cost Management: Monitoring usage and preventing unexpected charges
- – Browser Testing: Comprehensive testing across all major browsers and devices
- – Error Handling: Robust error management for geocoding failures and API limits
- – Security Maintenance: Regular updates to prevent API key exposure
- – Performance Optimization: Implementing clustering and lazy loading for 100+ points
- – Mobile Responsiveness: Complex touch gesture handling and responsive design
Plot Points Instantly with MapsFun.com
Why invest weeks in complex development when you can achieve professional results in minutes?
MapsFun.com eliminates all technical barriers while delivering enterprise-grade mapping capabilities:
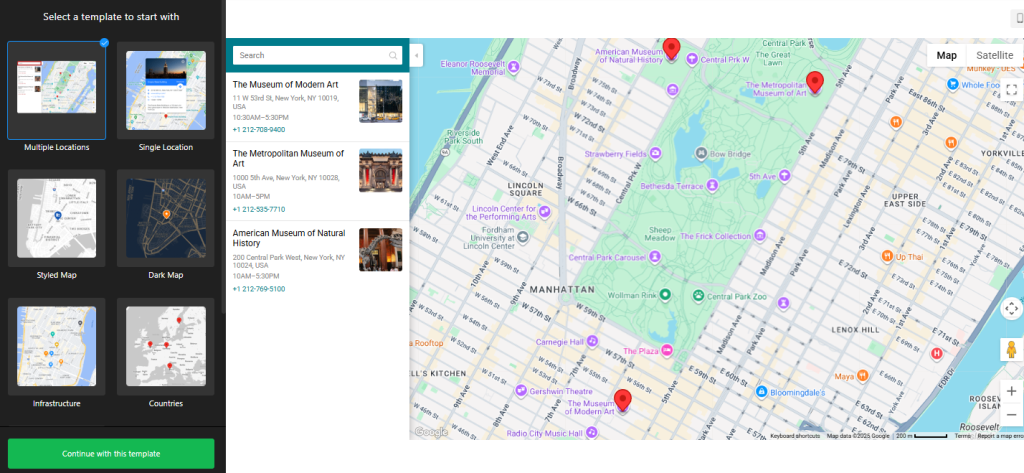
- 📍 Visual Point Management – Drag-and-drop interface with instant plotting
- 📊 Bulk Import – Upload CSV/Excel files with hundreds of locations instantly
- 🎨 Smart Categorization – Automatic point categorization with custom styling
- 🚀 Zero Configuration – No API keys, coding, or technical setup required
- 📱 Perfect Responsiveness – Automatically optimized for all devices
- 🔧 Real-time Collaboration – Multiple team members can edit simultaneously
- 📈 Analytics Integration – Track map engagement and user interactions
Stop wasting time on complex API integrations and fragile code. Create stunning, interactive multi-point maps in minutes at MapsFun.com – the intelligent solution for modern business mapping.