How to Put Multiple Points on Google Maps (2025 Quick Guide)
How to Put Multiple Points on Google Maps: The Technical Deep Dive
Need to plot multiple points on Google Maps for analytics, store locations, or event planning? While it seems straightforward, creating a functional, embeddable multi-point map involves navigating Google’s complex developer ecosystem. This comprehensive guide reveals the technically intensive process behind what appears to be a simple task.
The Reality Check: Three Methods Compared
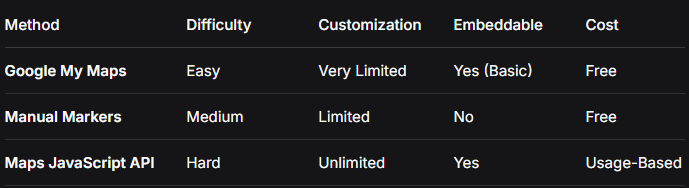
Method 1: Google My Maps (The Deceptively “Simple” Way)
Google’s consumer-facing tool seems perfect but has critical limitations.
The Process:
1. Navigate to [Google My Maps](https://www.google.com/maps/d/)
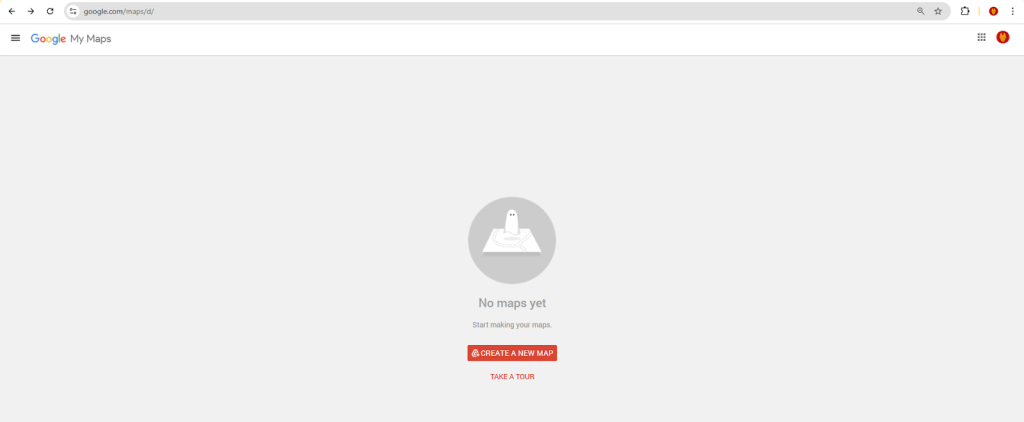
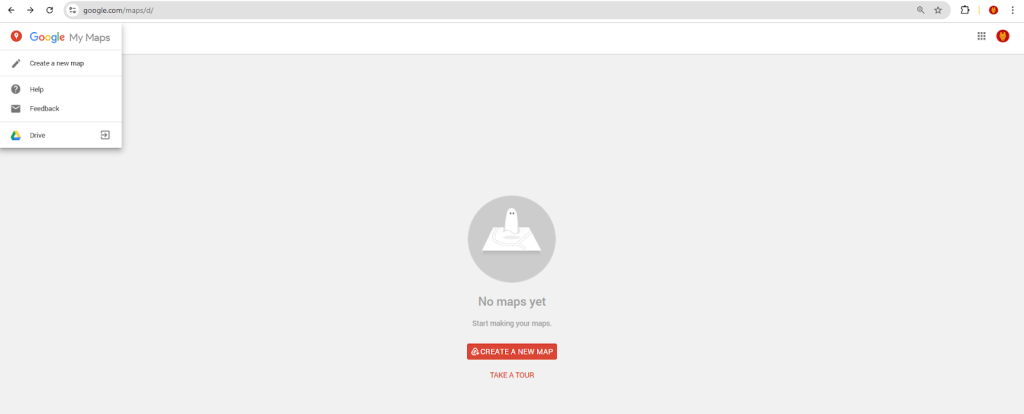
2. Click “Create a new map”
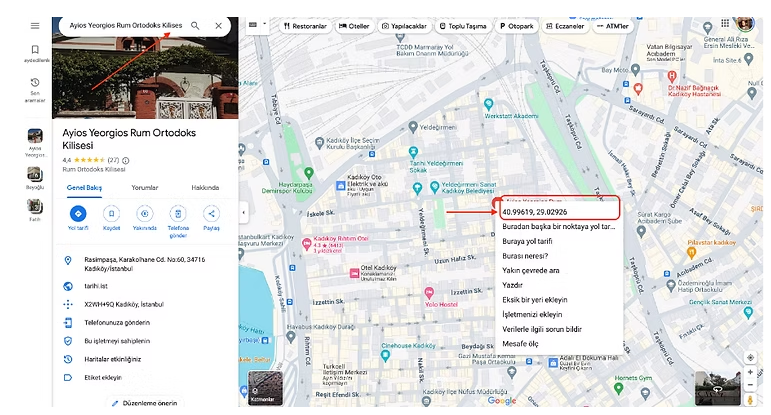
3. Use “Add marker” tool or search to place points
Google My Maps interface showing the manual point placement process.
4. Export limitations appear immediately:
- – Maximum 10 layers
- – 2,000 points per layer
- – No custom marker styling
- – Basic info windows only
Getting the Embed Code:
html
<!-- The restrictive iframe you get -->
<iframe
  src="https://www.google.com/maps/d/embed?mid=1abc123def456&z=10"
  width="640"
  height="480"
  style="border:0;">
</iframe>

<strong>This iframe is not responsive by default and lacks professional styling options.</strong>Code language: HTML, XML (xml)
Method 2: The Professional Approach – Google Maps JavaScript API
For a truly custom solution, you must become a Google Cloud developer.
Step 1: The Google Cloud Onboarding Gauntlet
- 1. Create a Google Cloud Account (different from Google account)
- 2. Set Up Billing (credit card required, despite $200 monthly credit)
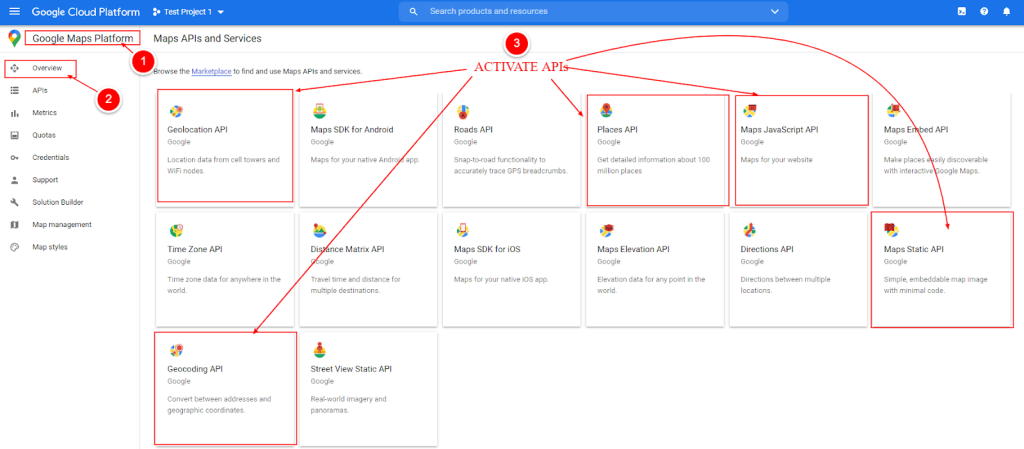
- 3. Enable Three Separate APIs:
- – Maps JavaScript API
- – Geocoding API (for address conversion)
- – Places API (for location details)
The complex API dashboard requiring multiple service activations.
- 4. Generate and Restrict API Keys (security mandatory)
- 5. Set Up Quotas and Alerts (to prevent unexpected charges)
Step 2: The Complex JavaScript Implementation
Here’s the actual code needed for a professional multi-point map:
html
<!DOCTYPE html>
<html>
<head>
    <title>Advanced Multi-Point Map</title>
    <meta name="viewport" content="width=device-width, initial-scale=1.0">
    <style>
        /* Critical: Map container styling */
        #advanced-points-map {
            height: 700px;
            width: 100%;
            border-radius: 16px;
            border: 1px solid #e0e0e0;
        }

        /* Custom controls */
        .map-interface {
            background: linear-gradient(135deg, #667eea 0%, #764ba2 100%);
            color: white;
            padding: 20px;
            border-radius: 16px;
            margin-bottom: 25px;
        }

        .point-counter {
            background: rgba(255,255,255,0.2);
            padding: 10px 20px;
            border-radius: 50px;
            display: inline-block;
            margin-top: 10px;
        }

        /* Marker cluster styling */
        .cluster-marker {
            background: #4CAF50;
            color: white;
            border-radius: 50%;
            padding: 15px;
            text-align: center;
            font-weight: bold;
            border: 3px solid white;
            box-shadow: 0 4px 12px rgba(0,0,0,0.15);
        }
    </style>

    <!-- Marker clustering library (additional dependency) -->
    <script src="https://unpkg.com/@googlemaps/markerclusterer/dist/index.min.js"></script>
</head>
<body>
    <div class="map-interface">
        <h2>📍 Multi-Point Location Map</h2>
        <p>Displaying <span class="point-counter" id="pointCount">0</span> points</p>
        <div>
            <button onclick="toggleHeatmap()">Toggle Heatmap</button>
            <button onclick="exportPoints()">Export Data</button>
            <button onclick="fitBounds()">View All Points</button>
        </div>
    </div>

    <div id="advanced-points-map"></div>

    <div id="pointList" style="margin-top: 20px; padding: 20px; background: #f8f9fa; border-radius: 12px;">
        <h4>📋 Points List</h4>
        <!-- Dynamically populated -->
    </div>

    <script>
        // CONFIGURATION - Replace with your data
        const CONFIG = {
            apiKey: 'YOUR_GOOGLE_MAPS_API_KEY_HERE', // Warning: Exposing this is risky
            points: [
                {
                    id: 1,
                    title: "Central Office",
                    address: "123 Business Ave, San Francisco, CA",
                    lat: 37.7749,
                    lng: -122.4194,
                    type: "office",
                    color: "#4285F4",
                    description: "Main headquarters with full facilities"
                },
                {
                    id: 2,
                    title: "Retail Store #1",
                    address: "456 Market St, San Francisco, CA",
                    lat: 37.7849,
                    lng: -122.4094,
                    type: "retail",
                    color: "#EA4335",
                    description: "Flagship retail location"
                },
                {
                    id: 3,
                    title: "Warehouse Facility",
                    address: "789 Industrial Way, Oakland, CA",
                    lat: 37.8000,
                    lng: -122.3000,
                    type: "warehouse",
                    color: "#FBBC05",
                    description: "Primary distribution center"
                },
                {
                    id: 4,
                    title: "Partner Location",
                    address: "321 Collaboration Blvd, San Jose, CA",
                    lat: 37.3382,
                    lng: -121.8863,
                    type: "partner",
                    color: "#34A853",
                    description: "Strategic partner office"
                },
                {
                    id: 5,
                    title: "Future Expansion",
                    address: "555 Growth Rd, Sacramento, CA",
                    lat: 38.5816,
                    lng: -121.4944,
                    type: "planned",
                    color: "#9C27B0",
                    description: "Planned Q4 2024 opening"
                }
            ]
        };

        // Global variables
        let map;
        let markers = [];
        let heatmap;
        let markerCluster;
        let infoWindow;

        // Initialize map
        function initMap() {
            // Create map instance
            map = new google.maps.Map(document.getElementById('advanced-points-map'), {
                zoom: 10,
                center: { lat: 37.7749, lng: -122.4194 },
                mapTypeControl: true,
                streetViewControl: false,
                fullscreenControl: true,
                styles: [
                    {
                        "featureType": "administrative",
                        "elementType": "labels.text.fill",
                        "stylers": [{ "color": "#666666" }]
                    }
                ]
            });

            infoWindow = new google.maps.InfoWindow({
                maxWidth: 300
            });

            // Create markers
            createMarkers();

            // Initialize marker clustering
            initMarkerClustering();

            // Initialize heatmap
            initHeatmap();

            // Update point counter
            updatePointCounter();

            // Generate point list
            generatePointList();
        }

        function createMarkers() {
            markers = CONFIG.points.map(point => {
                // Create custom marker icon
                const markerIcon = {
                    path: google.maps.SymbolPath.CIRCLE,
                    fillColor: point.color,
                    fillOpacity: 0.9,
                    strokeWeight: 2,
                    strokeColor: '#FFFFFF',
                    scale: 10
                };

                const marker = new google.maps.Marker({
                    position: { lat: point.lat, lng: point.lng },
                    map: map,
                    title: point.title,
                    icon: markerIcon,
                    animation: google.maps.Animation.DROP
                });

                // Add click event
                marker.addListener('click', () => {
                    const content = `
                        <div style="padding: 15px;">
                            <h3 style="margin: 0 0 10px 0; color: ${point.color};">${point.title}</h3>
                            <div style="background: ${point.color}20; padding: 8px; border-radius: 6px; margin-bottom: 10px;">
                                <strong>Type:</strong> ${point.type.toUpperCase()}
                            </div>
                            <p style="margin: 0 0 8px 0;"><strong>📍 Address:</strong><br>${point.address}</p>
                            <p style="margin: 0; font-size: 14px; color: #666;">${point.description}</p>
                        </div>
                    `;

                    infoWindow.setContent(content);
                    infoWindow.open(map, marker);

                    // Center on marker
                    map.panTo(marker.getPosition());
                });

                return marker;
            });
        }

        function initMarkerClustering() {
            markerCluster = new markerClusterer.MarkerClusterer({
                map,
                markers,
                renderer: {
                    render: ({ count, position }) => {
                        // Custom cluster rendering
                        return new google.maps.Marker({
                            position,
                            icon: {
                                path: google.maps.SymbolPath.CIRCLE,
                                scale: 15 + Math.min(count, 10) * 2,
                                fillColor: '#4285F4',
                                fillOpacity: 0.8,
                                strokeWeight: 3,
                                strokeColor: '#FFFFFF'
                            },
                            label: {
                                text: String(count),
                                color: 'white',
                                fontSize: '12px'
                            }
                        });
                    }
                }
            });
        }

        function initHeatmap() {
            const heatmapData = CONFIG.points.map(point =>
                new google.maps.LatLng(point.lat, point.lng)
            );

            heatmap = new google.maps.visualization.HeatmapLayer({
                data: heatmapData,
                map: null, // Start hidden
                radius: 30,
                opacity: 0.6
            });
        }

        function toggleHeatmap() {
            heatmap.setMap(heatmap.getMap() ? null : map);
        }

        function fitBounds() {
            const bounds = new google.maps.LatLngBounds();
            markers.forEach(marker => bounds.extend(marker.getPosition()));
            map.fitBounds(bounds);
            infoWindow.close();
        }

        function updatePointCounter() {
            document.getElementById('pointCount').textContent = CONFIG.points.length;
        }

        function generatePointList() {
            const container = document.getElementById('pointList');
            CONFIG.points.forEach(point => {
                const div = document.createElement('div');
                div.style.cssText = `
                    padding: 12px;
                    margin: 8px 0;
                    background: white;
                    border-left: 4px solid ${point.color};
                    border-radius: 8px;
                    cursor: pointer;
                    transition: transform 0.2s;
                `;
                div.innerHTML = `
                    <strong>${point.title}</strong><br>
                    <small style="color: #666;">${point.address}</small>
                `;
                div.addEventListener('click', () => {
                    markers[point.id - 1].setAnimation(google.maps.Animation.BOUNCE);
                    setTimeout(() => markers[point.id - 1].setAnimation(null), 1500);
                    map.panTo({ lat: point.lat, lng: point.lng });
                    map.setZoom(15);
                });
                container.appendChild(div);
            });
        }

        function exportPoints() {
            const dataStr = JSON.stringify(CONFIG.points, null, 2);
            const dataUri = 'data:application/json;charset=utf-8,'+ encodeURIComponent(dataStr);
            const link = document.createElement('a');
            link.setAttribute('href', dataUri);
            link.setAttribute('download', 'map-points-export.json');
            link.click();
        }

        // Load Google Maps API
        const script = document.createElement('script');
        script.src = `https://maps.googleapis.com/maps/api/js?key=${CONFIG.apiKey}&libraries=visualization&callback=initMap`;
        script.async = true;
        document.head.appendChild(script);
    </script>
</body>
</html>
Code language: HTML, XML (xml)
Step 3: The Hidden Requirements
- 1. Geocoding Service: Convert addresses to lat/lng (additional API calls)
- 2. Rate Limiting: Implement delays between API requests
- 3. Error Handling: Network failures, invalid coordinates, API quota exceeded
- 4. Mobile Optimization: Touch events, responsive design adjustments
- 5. Accessibility: ARIA labels, keyboard navigation support
The Five Critical Pain Points
1. API Key Security Nightmare
javascript
// Your key is exposed in client-side code
const apiKey = 'AIzaSyB_exposed_key_here'; // Vulnerable!Code language: PHP (php)Solution: Implement a backend proxy (additional server costs).
2. Geocoding Cost Surprises
- – First 40,000 requests: $0.005 each
- – Next 60,000 requests: $0.004 each
- – Example: 1,000 addresses = $5 monthly recurring cost
3. Performance Degradation
- – 50+ markers cause lag on mobile devices
- – Need clustering implementation (additional library)
- – Heatmap visualization requires separate library
4. Maintenance Overhead
javascript
// Every change requires code deployment
const points = [
    // Hard-coded data that's difficult to update
];Code language: JavaScript (javascript)
5. Browser Compatibility Issues*
- – Internet Explorer requires polyfills
- – Mobile Safari has touch event quirks
- – Older Android WebView limitations
The Technical Debt Timeline
- Day 1: Basic map working (4 hours)
- Week 1: Add clustering and heatmaps (8 hours)
- Month 1: Performance optimization needed (6 hours)
- Month 3: API key compromised, emergency fix (4 hours)
- Month 6: Google API pricing changes (3 hours)
- Total: 25+ hours of maintenance per year
The Professional Alternative: MapsFun.com
What if you could skip the 25+ hours of development and ongoing maintenance?
MapsFun.com provides enterprise-grade multi-point mapping without the technical complexity:
- 1. Visual Point Management: Click to add points or import CSV/Excel files
- 2. Smart Geocoding: Automatic address-to-coordinate conversion (no per-request fees)
- 3. Live Data Integration: Connect to Google Sheets, Airtable, or databases
- 4. Advanced Visualization: Built-in clustering, heatmaps, and territory drawing
- 5. One-Click Embed: Responsive, secure embed codes for any website
Stop building mapping infrastructure and start using maps that work. With MapsFun.com, you get professional multi-point maps in minutes—no coding, no API keys, no hidden costs. Focus on your data, not the plumbing to display it.