How to Plot Multiple Points on a Map (2025 Tutorial)
How to Plot Multiple Points on a Map: A Complete Technical Guide
Whether you’re visualizing customer locations, planning delivery routes, or showcasing service areas, plotting multiple points on a map is a common need for businesses. While Google Maps provides the foundation, implementing this functionality requires significant technical work.
Here’s your comprehensive guide to plotting multiple points using the Google Maps API.
Method 1: Technical Implementation with Google Maps API
Step 1: API Configuration and Setup
Before any coding begins, you must configure Google’s mapping services:
- 1. Google Cloud Project Setup
- – Navigate to [Google Cloud Console](https://console.cloud.google.com/)
- – Create a new project or select existing
- – Enable billing (requires credit card, but includes $200 monthly credit)
- 2. Enable Required Services
- In “APIs & Services > Library”, enable:
- – Maps JavaScript API (core mapping functionality)
- – Geocoding API (address to coordinates conversion)
- – Places API (for location search)
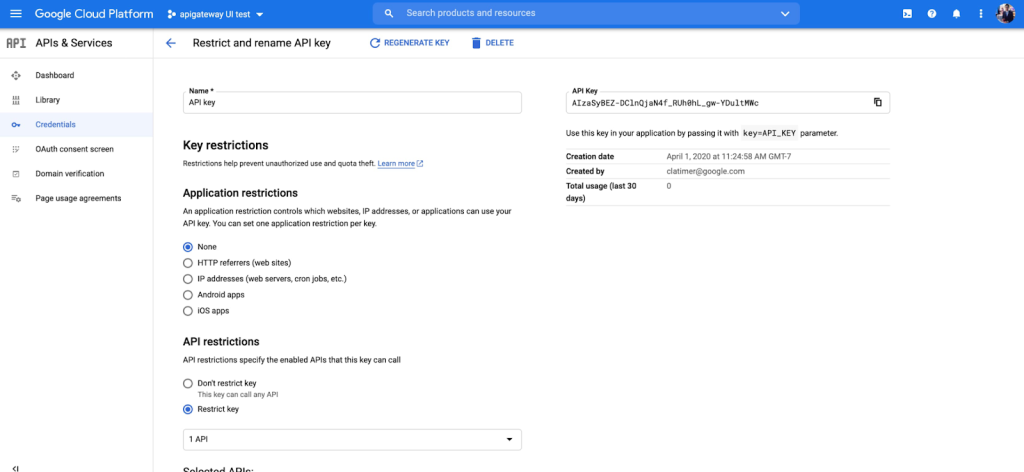
- 3. Generate Secure API Key
- – Create credentials > API Key
- – Restrict by HTTP referrers and API restrictions
- – Set quota limits to prevent unexpected charges
Step 2: Complete HTML/JavaScript Implementation
Create a new file `multi-point-map.html` with this complete code:
html
<!DOCTYPE html>
<html>
<head>
    <title>Multiple Points Map Plotter</title>
    <meta name="viewport" content="width=device-width, initial-scale=1.0">
    <style>
        #map-container {
            width: 100%;
            max-width: 1200px;
            margin: 0 auto;
            font-family: 'Segoe UI', Tahoma, Geneva, Verdana, sans-serif;
        }
        #map {
            height: 700px;
            width: 100%;
            border-radius: 10px;
            box-shadow: 0 4px 12px rgba(0,0,0,0.15);
            margin: 20px 0;
        }
        .controls {
            background: #f8f9fa;
            padding: 20px;
            border-radius: 8px;
            margin: 20px 0;
        }
        .location-card {
            background: white;
            padding: 15px;
            margin: 10px 0;
            border-radius: 6px;
            border-left: 4px solid #4285f4;
            box-shadow: 0 2px 4px rgba(0,0,0,0.1);
        }
        .cluster-marker {
            background: #ea4335;
            color: white;
            padding: 8px 12px;
            border-radius: 50%;
            font-weight: bold;
        }
    </style>
</head>
<body>
    <div id="map-container">
        <h1>Multi-Point Location Map</h1>

        <div class="controls">
            <h3>Plot Your Points</h3>
            <div>
                <input type="text" id="address-input" placeholder="Enter address to plot" style="padding: 10px; width: 300px; margin-right: 10px;">
                <button onclick="addPointFromAddress()" style="padding: 10px 20px; background: #4285f4; color: white; border: none; border-radius: 4px; cursor: pointer;">Add Point</button>
                <button onclick="clearAllPoints()" style="padding: 10px 20px; background: #ea4335; color: white; border: none; border-radius: 4px; cursor: pointer; margin-left: 10px;">Clear All</button>
            </div>
        </div>

        <div id="map"></div>

        <div id="points-list">
            <h3>Plotted Points (Total: <span id="points-count">0</span>)</h3>
            <div id="points-container"></div>
        </div>
    </div>

    <!-- Load Google Maps API with Places library -->
    <script src="https://maps.googleapis.com/maps/api/js?key=YOUR_API_KEY_HERE&libraries=places&callback=initializeMap" async defer></script>

    <script>
        let map;
        let markers = [];
        let geocoder;
        let infoWindow;
        let plottedPoints = [];

        function initializeMap() {
            // Initialize map with custom styling
            map = new google.maps.Map(document.getElementById('map'), {
                center: { lat: 39.8283, lng: -98.5795 }, // Center of US
                zoom: 4,
                styles: [
                    {
                        "featureType": "administrative",
                        "elementType": "labels.text.fill",
                        "stylers": [{"color": "#444444"}]
                    },
                    {
                        "featureType": "landscape",
                        "stylers": [{"color": "#f2f2f2"}]
                    },
                    {
                        "featureType": "poi",
                        "stylers": [{"visibility": "off"}]
                    },
                    {
                        "featureType": "road",
                        "stylers": [{"saturation": -100}, {"lightness": 45}]
                    }
                ]
            });

            geocoder = new google.maps.Geocoder();
            infoWindow = new google.maps.InfoWindow();

            // Sample initial points
            const initialPoints = [
                {
                    name: "New York Office",
                    position: { lat: 40.7128, lng: -74.0060 },
                    address: "Manhattan, New York, NY",
                    type: "office"
                },
                {
                    name: "Chicago Warehouse",
                    position: { lat: 41.8781, lng: -87.6298 },
                    address: "Chicago, IL",
                    type: "warehouse"
                },
                {
                    name: "Los Angeles Store",
                    position: { lat: 34.0522, lng: -118.2437 },
                    address: "Los Angeles, CA",
                    type: "store"
                },
                {
                    name: "Miami Distribution",
                    position: { lat: 25.7617, lng: -80.1918 },
                    address: "Miami, FL",
                    type: "distribution"
                },
                {
                    name: "Seattle Outpost",
                    position: { lat: 47.6062, lng: -122.3321 },
                    address: "Seattle, WA",
                    type: "outpost"
                }
            ];

            // Plot initial points
            initialPoints.forEach(point => {
                plotPoint(point);
            });
        }

        function plotPoint(pointData) {
            const marker = new google.maps.Marker({
                position: pointData.position,
                map: map,
                title: pointData.name,
                icon: getIconForType(pointData.type)
            });

            // Create info window content
            const infoContent = `
                <div style="padding: 15px; min-width: 200px;">
                    <h3 style="margin: 0 0 10px 0; color: #1a73e8;">${pointData.name}</h3>
                    <p style="margin: 5px 0; color: #5f6368;"><strong>Type:</strong> ${pointData.type}</p>
                    <p style="margin: 5px 0; color: #5f6368;"><strong>Address:</strong> ${pointData.address}</p>
                    <p style="margin: 5px 0; color: #5f6368;"><strong>Coordinates:</strong> ${pointData.position.lat.toFixed(4)}, ${pointData.position.lng.toFixed(4)}</p>
                    <button onclick="focusOnPoint(${pointData.position.lat}, ${pointData.position.lng})"
                            style="margin-top: 10px; padding: 8px 15px; background: #1a73e8; color: white; border: none; border-radius: 4px; cursor: pointer;">
                        Focus on Point
                    </button>
                </div>
            `;

            marker.addListener('click', () => {
                infoWindow.setContent(infoContent);
                infoWindow.open(map, marker);
            });

            markers.push(marker);
            plottedPoints.push(pointData);

            updatePointsList();
            adjustMapBounds();
        }

        function getIconForType(type) {
            const baseUrl = 'https://maps.google.com/mapfiles/ms/icons/';
            const colors = {
                'office': 'blue',
                'warehouse': 'red',
                'store': 'green',
                'distribution': 'orange',
                'outpost': 'purple'
            };
            return `${baseUrl}${colors[type] || 'blue'}-dot.png`;
        }

        function addPointFromAddress() {
            const address = document.getElementById('address-input').value;
            if (!address) {
                alert('Please enter an address');
                return;
            }

            geocoder.geocode({ address: address }, (results, status) => {
                if (status === 'OK') {
                    const location = results[0].geometry.location;
                    const newPoint = {
                        name: `Point ${plottedPoints.length + 1}`,
                        position: { lat: location.lat(), lng: location.lng() },
                        address: results[0].formatted_address,
                        type: 'office'
                    };
                    plotPoint(newPoint);
                    document.getElementById('address-input').value = '';
                } else {
                    alert('Geocode was not successful: ' + status);
                }
            });
        }

        function clearAllPoints() {
            markers.forEach(marker => marker.setMap(null));
            markers = [];
            plottedPoints = [];
            updatePointsList();
        }

        function updatePointsList() {
            const container = document.getElementById('points-container');
            const countElement = document.getElementById('points-count');

            countElement.textContent = plottedPoints.length;
            container.innerHTML = '';

            plottedPoints.forEach((point, index) => {
                const pointElement = document.createElement('div');
                pointElement.className = 'location-card';
                pointElement.innerHTML = `
                    <h4>${point.name}</h4>
                    <p><strong>Address:</strong> ${point.address}</p>
                    <p><strong>Coordinates:</strong> ${point.position.lat.toFixed(6)}, ${point.position.lng.toFixed(6)}</p>
                    <p><strong>Type:</strong> ${point.type}</p>
                    <button onclick="focusOnPoint(${point.position.lat}, ${point.position.lng})"
                            style="padding: 5px 10px; background: #34a853; color: white; border: none; border-radius: 3px; cursor: pointer; margin-right: 5px;">
                        View
                    </button>
                    <button onclick="removePoint(${index})"
                            style="padding: 5px 10px; background: #ea4335; color: white; border: none; border-radius: 3px; cursor: pointer;">
                        Remove
                    </button>
                `;
                container.appendChild(pointElement);
            });
        }

        function focusOnPoint(lat, lng) {
            map.setCenter({ lat, lng });
            map.setZoom(12);
        }

        function removePoint(index) {
            if (index >= 0 && index < markers.length) {
                markers[index].setMap(null);
                markers.splice(index, 1);
                plottedPoints.splice(index, 1);
                updatePointsList();
                adjustMapBounds();
            }
        }

        function adjustMapBounds() {
            if (markers.length === 0) return;

            const bounds = new google.maps.LatLngBounds();
            markers.forEach(marker => {
                bounds.extend(marker.getPosition());
            });
            map.fitBounds(bounds);
        }

        // Handle API errors
        window.gm_authFailure = function() {
            alert('Error: Google Maps API failed to load. Please check your API key and billing setup.');
        };
    </script>
</body>
</html>
Code language: HTML, XML (xml)
Replace `YOUR_API_KEY_HERE` with your actual Google Maps API key.
Step 3: Implementation Challenges
When deploying this solution, expect to encounter:
- – API quota limitations and rate limiting
- – Geocoding accuracy issues with certain addresses
- – Browser compatibility problems, especially with older browsers
- – Mobile touch event handling complexities
- – Performance degradation with 50+ simultaneous points
- – SSL/TLS requirements for modern browser APIs
The Technical Debt of DIY Point Plotting
While the coded solution provides maximum flexibility, it comes with substantial overhead:
- – Development Time: 15-25 hours for robust implementation
- – Ongoing Maintenance: API changes require regular code updates
- – Error Handling: Comprehensive error management for geocoding failures
- – Performance Optimization: Clustering and lazy loading for large datasets
- – Security Management: API key protection and usage monitoring
- – Cross-platform Testing: Ensuring compatibility across all devices and browsers
Plot Points Instantly with MapsFun.com
Why invest weeks in development and maintenance when you can achieve professional results in minutes?
MapsFun.com provides an enterprise-grade mapping solution without the technical complexity:
- 📍 One-Click Point Plotting – Upload CSV or add points visually
- 🎯 Smart Geocoding – Accurate address recognition automatically
- 🚀 Instant Performance – Optimized for thousands of points
- 📊 Advanced Clustering – Automatic point grouping at different zoom levels
- 🎨 Custom Styling – Professional designs without CSS knowledge
- 📱 Fully Responsive – Perfect experience on all devices
Stop wasting time on complex API integrations and fragile code. Create beautiful, interactive multi-point maps in minutes at MapsFun.com – the modern solution for business mapping needs.