Mapping Software for Multiple Locations (2025 Best Tools)
Choosing the Right Mapping Software for Multiple Locations: A Developer’s Guide
Need to plot dozens, hundreds, or even thousands of locations on an interactive map for your website or application? The choice of mapping software is critical. While building a custom solution from scratch offers maximum control, it comes with significant complexity. This guide compares two primary approaches: using a low-level API and leveraging a specialized platform.
The Core Challenge: Data, Performance, and Usability
When dealing with multiple locations, simple markers aren’t enough. You need to consider:
- Data Management: How do you import, update, and manage large location datasets?
- Performance: How will the map handle 500+ markers without crashing the user’s browser?
- Clustering: How to group nearby points for a clean, readable view at high levels?
- Customization: Can you match the map style to your brand and add rich info windows?
Method 1: Building with Leaflet.js & OpenStreetMap (The Open-Source Toolkit)
This is a popular, powerful alternative to Google Maps that avoids vendor lock-in. It’s more flexible than the bare Google API but still requires deep technical work.
Step 1: Set Up Your Base Map
First, include the Leaflet.js library and its CSS in your HTML file.
html
<!DOCTYPE html>
<html>
<head>
    <title>Multi-Location Map with Leaflet</title>
    <link rel="stylesheet" href="https://unpkg.com/leaflet@1.9.4/dist/leaflet.css" />
    <script src="https://unpkg.com/leaflet@1.9.4/dist/leaflet.js"></script>
    <style>
        #map { height: 500px; width: 100%; }
        /* Custom cluster icon style */
        .cluster-icon {
            background: #3498db;
            border-radius: 50%;
            text-align: center;
            color: white;
            font-weight: bold;
        }
    </style>
</head>
<body>
    <div id="map"></div>
</body>
</html>
Code language: HTML, XML (xml)
Step 2: Initialize Map and Add a Tile Layer
Add this script to initialize the map centered on your preferred coordinates.
javascript
<script>
    // Initialize the map
    var map = L.map('map').setView([51.505, -0.09], 11); // London coordinates

    // Add OpenStreetMap tile layer (free, but requires attribution)
    L.tileLayer('https://tile.openstreetmap.org/{z}/{x}/{y}.png', {
        attribution: '© <a href="https://www.openstreetmap.org/copyright">OpenStreetMap</a> contributors'
    }).addTo(map);
</script>
Code language: HTML, XML (xml)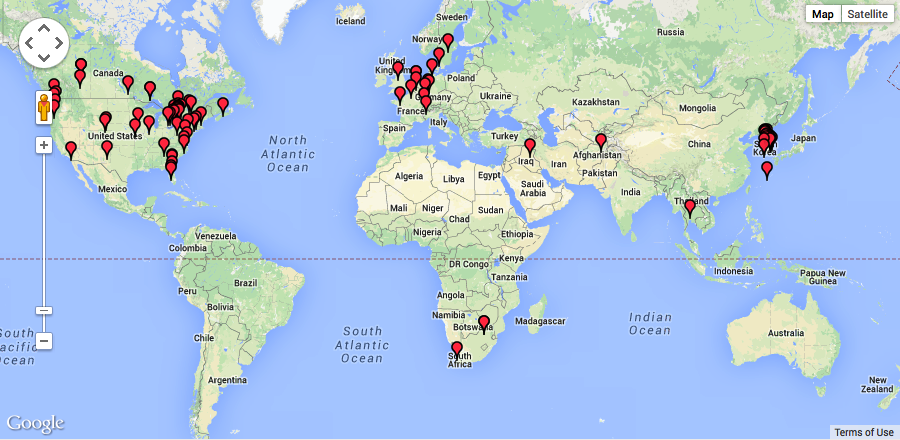
Step 3: Handle Multiple Locations with Clustering
For 10+ locations, you must implement clustering. Manually adding each marker is impractical. Here’s how to use a GeoJSON dataset with the `Leaflet.markercluster` plugin.
- 1. Include the clustering plugin:
html
 <link rel="stylesheet" href="https://unpkg.com/leaflet.markercluster@1.5.3/dist/MarkerCluster.css" />
    <script src="https://unpkg.com/leaflet.markercluster@1.5.3/dist/leaflet.markercluster.js"></script>
Code language: HTML, XML (xml)- 2. Create a cluster group and add locations from a GeoJSON array:
- javascript
// Create a marker cluster group
    var markers = L.markerClusterGroup({
        iconCreateFunction: function(cluster) {
            // Custom cluster icon
            return L.divIcon({
                html: '<div class="cluster-icon">' + cluster.getChildCount() + '</div>',
                className: 'custom-cluster'
            });
        }
    });

    // Example GeoJSON data for locations
    var locationsGeoJSON = {
        "type": "FeatureCollection",
        "features": [
            {
                "type": "Feature",
                "properties": {"name": "Store A", "type": "Retail"},
                "geometry": {"type": "Point", "coordinates": [-0.09, 51.505]}
            },
            {
                "type": "Feature",
                "properties": {"name": "Warehouse B"},
                "geometry": {"type": "Point", "coordinates": [-0.11, 51.52]}
            }
            // Add hundreds more features here...
        ]
    };

    // Add GeoJSON data to the cluster group
    L.geoJSON(locationsGeoJSON, {
        pointToLayer: function(feature, latlng) {
            return L.marker(latlng).bindPopup(feature.properties.name);
        }
    }).addTo(markers);

    // Add the cluster group to the map
    map.addLayer(markers);
Code language: JavaScript (javascript)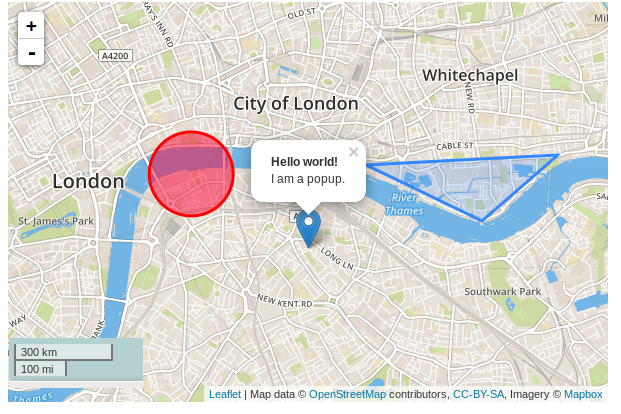
Step 4: Add Advanced Features (Heatmaps, Filters)
To visualize density, you’d need another plugin like `Leaflet.heat`. For filtering locations by category (e.g., “Show only warehouses”), you must write custom JavaScript to loop through all markers and show/hide them based on properties.
javascript
// Example: Filtering logic you'd need to write manually
function filterMarkers(category) {
    markers.eachLayer(function(layer) {
        var props = layer.feature.properties;
        layer.setVisible(!category || props.type === category);
    });
}Code language: JavaScript (javascript)
The Development Burden
As demonstrated, building multi-location mapping software requires:
- Integrating multiple libraries (Leaflet + Cluster + Heatmap + maybe more)
- Data formatting into GeoJSON
- Writing complex JavaScript for every interactive feature
- Managing map performance and browser memory
- Building a backend admin panel if non-technical users need to update locations
This approach can take weeks of development and ongoing maintenance.
Method 2: The Professional Shortcut – MapsFun.com
Why spend months building what already exists as a polished, no-code product?
MapsFun.com is specialized mapping software designed specifically for managing and displaying multiple locations with zero coding.
What makes it the ideal multi-location mapping software:
1. Bulk Upload & Live Management: Simply upload a CSV/Excel file with your addresses, or add locations manually through an intuitive dashboard. Update them anytime—the embedded map updates automatically.
2. Automated Smart Features:
- Auto-Clustering: Built-in, customizable clustering works out of the box.
- Smart Geocoding: Converts addresses to coordinates automatically.
- Live Filters: Add dropdown filters (by category, region, etc.) without coding.
- Heatmap Overlays: Visualize location density with one click.
3. Professional Embeds: Get a responsive, SEO-friendly embed code or a full-page shareable map link. The map loads fast and works perfectly on all devices.
4. Custom Branding: Match colors, choose map styles (Google, OpenStreetMap, Mapbox), and design custom info windows with photos and buttons.
Stop building mapping software from scratch. Whether you need to show 50 store locations or 10,000 service areas, MapsFun.com provides enterprise-grade mapping capabilities instantly. Create your first multi-location map in under 5 minutes—no APIs, no code, no complex plugins.