How to Add Points on Google Maps (2025 Step-by-Step Guide)
How to Add Points on Google Map: Complete Guide for Beginners & Developers
Adding custom points to Google Maps transforms a generic map into a powerful tool for your business or project. Whether you’re showcasing multiple store locations, planning travel routes, or visualizing data, customized maps dramatically improve user engagement. This comprehensive guide covers every method available—from simple no-code tools to advanced development techniques.
Why Add Custom Points to Google Maps?
Before diving into the methods, understanding the applications helps you choose the right approach:
- – Business Locations: Display stores, offices, or service areas
- – Event Planning: Show venue locations, parking, and points of interest
- – Real Estate: Highlight properties, neighborhoods, and amenities
- – Travel Planning: Plot itineraries, accommodations, and attractions
- – Data Visualization: Represent geographical data sets
- – Educational Content: Create interactive learning materials
- – Personal Projects: Document trips, memories, or collections
Method 1: The Simplest Way (No Coding Required)
Using Google My Maps – Free & Accessible
Google’s own free tool, My Maps, offers the easiest entry point for creating custom maps with points.
Step-by-Step Process:
- 1. Access Google My Maps:
- – Go to [Google My Maps](https://www.google.com/maps/d/)
- – Sign in with your Google account
- – Click “Create a New Map”
- 2. Set Your Map Foundation
- – Name your map descriptively (e.g., “Coffee Shops in Portland”)
- – Add a helpful description for context
- – Choose a base map style (Default, Light, Dark, Satellite)
- 3. Add Your First Point Manually
- – Click the marker icon below the search bar
- – Click anywhere on the map to place a point
- – A dialog box appears where you can:
- * Name the location
- * Add description text
- * Upload photos
- * Choose custom marker colors and icons
- – Click “Save” to add the point
- 4. Add Multiple Points Efficiently
- – Import Spreadsheet Data: Click “Import” to upload CSV, Excel, or Google Sheets files containing addresses or coordinates
- – Layer Organization: Create separate layers for different point categories (e.g., “Restaurants,” “Hotels,” “Attractions”)
- – Batch Editing: Select multiple points to change their icon style simultaneously
- 5. Customize Point Appearance
- – Click any point to open its information window
- – Select “Style” (paint bucket icon)
- – Choose from:
- * Uniform style (all points look identical)
- * Sequence of colors/letters/numbers
- * Individual styles (each point unique)
- * Style by data column (color-code by category)
- 6. Share and Embed Your Map
- – Click “Share” to adjust privacy settings (Public, Anyone with link, Private)
- – For website embedding:
- * Click the three-dot menu
- * Select “Embed on my site”
- * Copy the provided iframe code
- * Paste into your website’s HTML
Pros of Google My Maps:
- – Completely free with no usage limits
- – No technical knowledge required
- – Integrates seamlessly with Google Drive
- – Real-time collaboration features
- – Mobile-friendly outputs
Limitations:
- – Basic customization options
- – Limited to 10,000 points per layer
- – Embed styling may not match your website
- – Advanced features require upgrades
Method 2: Intermediate Solution Using Spreadsheets
Bulk Import with Google Sheets Integration
For larger datasets or regularly updated points, spreadsheet integration provides efficiency.
Implementation Guide:
- 1. Prepare Your Data in Google Sheets
- – Create columns with these headers (minimum requirements):
- (Location Name | Address | Latitude | Longitude | Category | Description)
- 2. Geocode Addresses to Coordinates
- – Use the `GOOGLEMAPS` function in Google Sheets (requires API or add-on)
- – Or use free geocoding services like [OpenCage](https://opencagedata.com) or [Nominatim](https://nominatim.org)
- – Copy-paste coordinates into your spreadsheet
- 3. Import to Google My Maps
- – In My Maps, click “Import”
- – Select your Google Sheets file
- – Choose the column to use for location titles
- – Select the column for placemarks
- 4. Automate Updates with Scripts
- – Use Google Apps Script to automatically sync data
- – Set time-based triggers for daily/weekly updates
- – Implement webhook receivers for real-time updates
Advanced Spreadsheet Technique:
javascript
// Sample Google Apps Script for automatic updates
function updateMapPoints() {
  var sheet = SpreadsheetApp.getActiveSpreadsheet().getSheetByName("Locations");
  var data = sheet.getDataRange().getValues();

  // Process and send to mapping service
  // This is a conceptual example - actual implementation varies by service
}Code language: JavaScript (javascript)
Method 3: Professional Implementation with Google Maps API
Complete Developer’s Guide
For full control and customization, the Google Maps JavaScript API provides maximum flexibility.
Prerequisites:
- – Basic HTML/CSS/JavaScript knowledge
- – Google Cloud Platform account
- – Understanding of web development concepts
Step 1: Set Up Google Cloud Project
- 1. Create a project in [Google Cloud Console](https://console.cloud.google.com)
- 2. Enable the Maps JavaScript API and Geocoding API
- 3. Create API credentials with appropriate restrictions
- 4. Note your API key for implementation
Step 2: Build the HTML Foundation
html
<!DOCTYPE html>
<html>
<head>
    <title>Interactive Custom Map</title>
    <style>
        #map-container {
            width: 100%;
            max-width: 1200px;
            margin: 0 auto;
            padding: 20px;
        }
        #map {
            height: 600px;
            width: 100%;
            border-radius: 8px;
            box-shadow: 0 4px 12px rgba(0,0,0,0.1);
        }
        .controls {
            margin-bottom: 20px;
            padding: 15px;
            background: #f8f9fa;
            border-radius: 8px;
        }
    </style>
</head>
<body>
    <div id="map-container">
        <div class="controls">
            <h2>Custom Map with Points</h2>
            <button onclick="addSamplePoints()">Load Example Points</button>
            <button onclick="clearAllPoints()">Clear All Points</button>
        </div>
        <div id="map"></div>
    </div>

    <!-- Load Google Maps API -->
    <script src="https://maps.googleapis.com/maps/api/js?key=YOUR_API_KEY&callback=initMap" async defer></script>

    <script>
        // Map and markers variables
        let map;
        let markers = [];
        let infoWindow;

        // Initialize the map
        function initMap() {
            // Default center (can be adjusted)
            const defaultCenter = { lat: 40.7128, lng: -74.0060 }; // New York

            // Create map instance
            map = new google.maps.Map(document.getElementById('map'), {
                center: defaultCenter,
                zoom: 12,
                mapTypeControl: true,
                streetViewControl: true,
                fullscreenControl: true
            });

            // Initialize info window
            infoWindow = new google.maps.InfoWindow();

            // Load initial points if needed
            // loadInitialPoints();
        }

        // Function to add a single point
        function addPoint(latitude, longitude, title, description, iconUrl = null) {
            const position = { lat: latitude, lng: longitude };

            // Custom marker options
            const markerOptions = {
                position: position,
                map: map,
                title: title,
                animation: google.maps.Animation.DROP
            };

            // Add custom icon if provided
            if (iconUrl) {
                markerOptions.icon = {
                    url: iconUrl,
                    scaledSize: new google.maps.Size(40, 40)
                };
            }

            // Create the marker
            const marker = new google.maps.Marker(markerOptions);

            // Store reference for later management
            markers.push(marker);

            // Add click listener for info window
            marker.addListener('click', () => {
                infoWindow.setContent(`
                    <div class="info-window">
                        <h3>${title}</h3>
                        <p>${description}</p>
                        <p><strong>Coordinates:</strong> ${latitude.toFixed(4)}, ${longitude.toFixed(4)}</p>
                        <button onclick="getDirections(${latitude}, ${longitude})">Get Directions</button>
                    </div>
                `);
                infoWindow.open(map, marker);
            });

            return marker;
        }

        // Function to add multiple points from an array
        function addMultiplePoints(pointsArray) {
            const bounds = new google.maps.LatLngBounds();

            pointsArray.forEach(point => {
                const marker = addPoint(
                    point.lat,
                    point.lng,
                    point.title,
                    point.description,
                    point.iconUrl
                );

                // Extend bounds to include this point
                bounds.extend(marker.getPosition());
            });

            // Adjust map view to show all markers
            if (pointsArray.length > 1) {
                map.fitBounds(bounds);
            }
        }

        // Example function with sample data
        function addSamplePoints() {
            const samplePoints = [
                {
                    lat: 40.7128,
                    lng: -74.0060,
                    title: "New York Headquarters",
                    description: "Our main office in downtown Manhattan",
                    iconUrl: "https://maps.google.com/mapfiles/ms/icons/blue-dot.png"
                },
                {
                    lat: 34.0522,
                    lng: -118.2437,
                    title: "Los Angeles Branch",
                    description: "West coast operations center",
                    iconUrl: "https://maps.google.com/mapfiles/ms/icons/green-dot.png"
                },
                {
                    lat: 41.8781,
                    lng: -87.6298,
                    title: "Chicago Office",
                    description: "Midwest regional headquarters",
                    iconUrl: "https://maps.google.com/mapfiles/ms/icons/red-dot.png"
                },
                {
                    lat: 29.7604,
                    lng: -95.3698,
                    title: "Houston Facility",
                    description: "Southern operations and logistics",
                    iconUrl: "https://maps.google.com/mapfiles/ms/icons/yellow-dot.png"
                },
                {
                    lat: 33.4484,
                    lng: -112.0740,
                    title: "Phoenix Outpost",
                    description: "Southwest customer service center",
                    iconUrl: "https://maps.google.com/mapfiles/ms/icons/purple-dot.png"
                }
            ];

            addMultiplePoints(samplePoints);
        }

        // Function to clear all points
        function clearAllPoints() {
            markers.forEach(marker => {
                marker.setMap(null);
            });
            markers = [];
            infoWindow.close();
        }

        // Function to get directions (conceptual)
        function getDirections(lat, lng) {
            // In a real implementation, this would open Google Maps with directions
            const directionsUrl = `https://www.google.com/maps/dir/?api=1&destination=${lat},${lng}`;
            window.open(directionsUrl, '_blank');
        }

        // Function to load points from a JSON file or API
        async function loadPointsFromAPI(apiUrl) {
            try {
                const response = await fetch(apiUrl);
                const points = await response.json();
                addMultiplePoints(points);
            } catch (error) {
                console.error('Error loading points:', error);
            }
        }

        // Initialize when page loads
        window.onload = initMap;
    </script>
</body>
</html>
Code language: HTML, XML (xml)
Step 3: Advanced Features Implementation
- 1. Custom Marker Clustering (for 100+ points):
- javascript
// Add marker clustering for better performance
const markerCluster = new MarkerClusterer(map, markers, {
    imagePath: 'https://developers.google.com/maps/documentation/javascript/examples/markerclusterer/m',
    maxZoom: 15,
    gridSize: 60
});
Code language: JavaScript (javascript)- 2. Geocoding Addresses Dynamically:
- javascript
async function addPointByAddress(address, title, description) {
    const geocoder = new google.maps.Geocoder();

    geocoder.geocode({ address: address }, (results, status) => {
        if (status === 'OK') {
            const location = results[0].geometry.location;
            addPoint(location.lat(), location.lng(), title, description);
        } else {
            console.error('Geocode failed:', status);
        }
    });
}Code language: JavaScript (javascript)- 3. Drawing Shapes and Areas:
- javascript
// Draw a circle around a point
function drawRadius(pointLat, pointLng, radiusMeters) {
    const circle = new google.maps.Circle({
        strokeColor: "#FF0000",
        strokeOpacity: 0.8,
        strokeWeight: 2,
        fillColor: "#FF0000",
        fillOpacity: 0.35,
        map: map,
        center: { lat: pointLat, lng: pointLng },
        radius: radiusMeters
    });
}Code language: JavaScript (javascript)
Step 4: Optimization and Best Practices
- 1. API Key Security:
- – Restrict API keys to specific HTTP referrers
- – Set usage quotas and alerts
- – Regularly rotate keys in production environments
- 2. Performance Optimization:
- – Implement marker clustering for large datasets
- – Use server-side rendering for initial points
- – Implement lazy loading for off-screen markers
- 3. User Experience Enhancements:
- – Add search/filter functionality
- – Implement categories with toggle visibility
- – Add drawing tools for user customization
- – Include export functionality (KML, CSV)
Method 4: Using Third-Party Mapping Platforms
When to Consider Alternative Solutions
While Google Maps dominates, specialized platforms offer unique advantages:
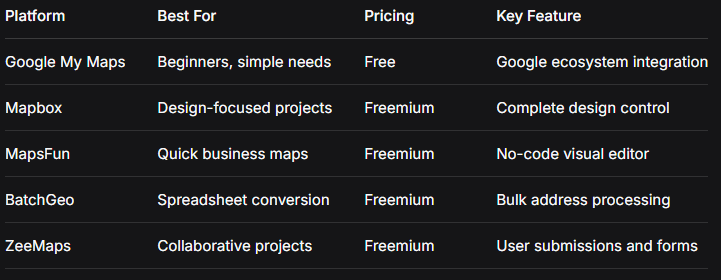
Best For Non-Developers:
- – MapsFun.com: Visual editor with custom styling
- – Mapbox: Design-focused with extensive customization
- – BatchGeo: Simple spreadsheet-to-map conversion
- – ZeeMaps: Collaborative mapping with form collection
Comparison of Popular Platforms
Choosing the Right Method: Decision Guide
Considerations for Selection:
- 1. Technical Skill Level:
- – No experience: Google My Maps or MapsFun
- – Basic web skills: Spreadsheet integration
- – Developer: Google Maps API or Mapbox
- 2. Project Scale:
- – Small (1-50 points): Any method works
- – Medium (50-1,000 points): API or specialized platforms
- – Large (1,000+ points): API with clustering and optimization
- 3. Customization Needs:
- – Basic: Standard icons and info windows
- – Moderate: Custom colors and categories
- – Advanced: Complete visual control and interactivity
- 4. Budget Constraints:
- – Free: Google My Maps (with usage limits)
- – Low-cost: Third-party platforms with free tiers
- – Enterprise: API-based solutions with support
Common Challenges and Solutions
Problem 1: Addresses Won’t Geocode Accurately
Solution: Use multiple geocoding services, manually verify coordinates, implement address validation before processing.
Problem 2: Performance Issues with Many Points
Solution: Implement clustering, server-side rendering, pagination, or heatmaps instead of individual markers.
Problem 3: Mobile Responsiveness Problems
Solution: Use percentage-based dimensions, touch-optimized controls, and test on multiple device sizes.
Problem 4: API Costs Unexpectedly High
Solution: Set budget alerts, implement caching, use static maps where appropriate, monitor usage patterns.
Problem 5: Map Doesn’t Match Website Design
Solution: Use custom styles with Mapbox or Google Styled Maps, ensure consistent color schemes and typography.
Future-Proofing Your Map Implementation
Emerging Trends to Consider:
- 1. 3D Mapping: Implementing elevation and building data
- 2. AR Integration: Mobile augmented reality overlays
- 3. Real-Time Updates: Live location tracking and updates
- 4. Accessibility Features: Screen reader support and keyboard navigation
- 5. Offline Functionality: Caching for limited connectivity situations
Conclusion: Start Simple, Scale as Needed
Adding points to Google Maps has evolved from a developer-only task to an accessible function for anyone with a digital project. The key to success is matching the method to your specific needs:
- – For immediate, simple needs: Start with Google My Maps
- – For regular updates from data: Use spreadsheet integration
- – For complete control and customization: Invest in API implementation
- – For design-focused projects: Explore specialized platforms
Remember that the best solution often evolves with your project. Many successful implementations begin with a simple tool like Google My Maps and gradually migrate to more sophisticated solutions as needs grow in complexity.
The most important step is to begin. Create your first map with a handful of points, share it with users, gather feedback, and iterate. Each map tells a story—your tools simply help you tell it more effectively.
Next Steps:
- 1. Identify your primary use case and technical comfort level
- 2. Choose one method from this guide that matches your needs
- 3. Create a test map with 5-10 points
- 4. Evaluate the user experience and functionality
- 5. Scale up or adjust methods based on feedback
Whether you’re plotting a single important location or visualizing thousands of data points, the ability to add custom points to Google Maps opens powerful possibilities for communication, analysis, and engagement.