How to Plot Multiple Points on Google Maps (2025 Step-by-Step Tutorial)
How to Plot Multiple Points on Google Maps: The Ultimate 2025 Guide
Need to display multiple locations, coordinates, or addresses on Google Maps? Whether you’re mapping store locations, event venues, or custom points of interest, this comprehensive guide covers all methods from simple to advanced.
Quick Method Comparison
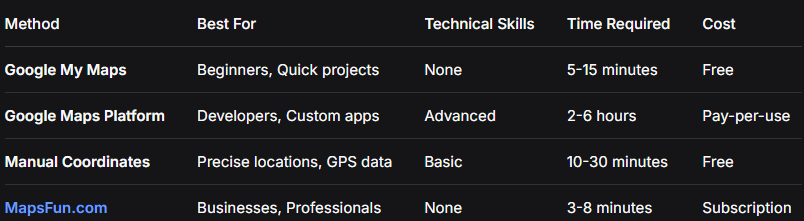
Method 1: Google My Maps (Easiest Approach)
Step-by-Step Guide
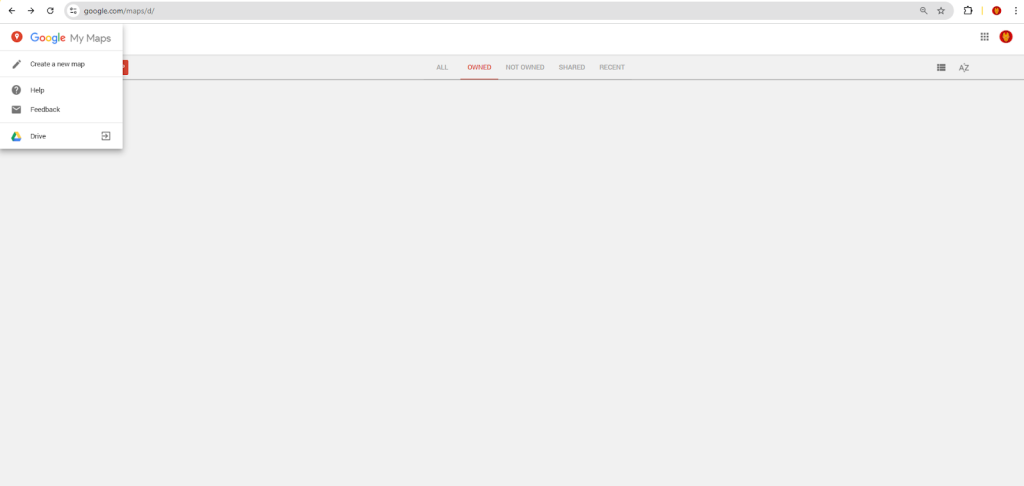
1. Create Your Map
- – Visit [Google My Maps](https://www.google.com/maps/d/)
- – Click “Create a New Map”
- – Sign in with Google account
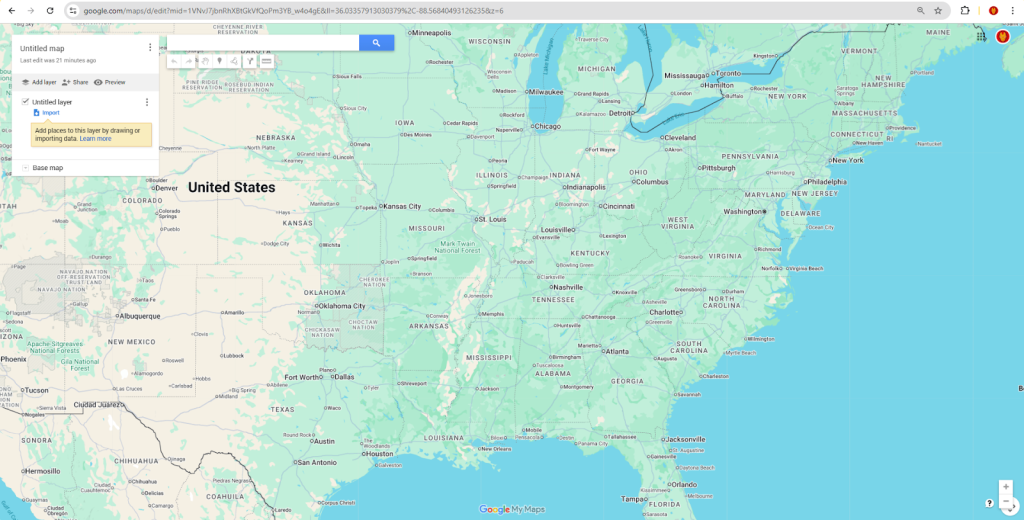
2. Add Points – Three Methods
Method A: Search and Click
- – Use search bar: “Add to map”
- – Search for addresses or places
- – Click “Add to map” for each location
Method B: Import Coordinates (CSV)
- – Click “Import” under first layer
- – Upload CSV file with coordinates
- – Format: `Name,Latitude,Longitude,Description`
Sample CSV for Coordinates:
csv
Name,Latitude,Longitude,Type,Description
Central Park,40.7829,-73.9654,Park,Main entrance
Times Square,40.7580,-73.9855,Landmark,Busy intersection
Brooklyn Bridge,40.7061,-73.9969,Bridge,Viewing point
Code language: CSS (css)
Method C: Manual Point Placement
- – Click the marker icon in toolbar
- – Click exact spot on map
- – Add point details in popup
3. Customize Points
- – Colors: Click point → “Style” → Choose color
- – Icons: Use different markers for categories
- – Labels: Add numbers or text labels
- – Layers: Organize points into separate layers
4. Add Detailed Information
For each point, include:
- – Title and description
- – Photos or images
- – Contact information
- – Custom fields
- – Links to websites
5. Share Your Map
html
<!-- Embed code for websites -->
<iframe
  src="https://www.google.com/maps/d/embed?mid=YOUR_MAP_ID"
  width="800"
  height="600"
  style="border: 1px solid #ddd; border-radius: 8px;">
</iframe>
Code language: HTML, XML (xml)
Method 2: Google Maps Platform (Full Control)
For Developers Needing Custom Solutions
API Setup Required
javascript
// Enable in Google Cloud Console:
// - Maps JavaScript API
// - Geocoding API (for address conversion)

// Security setup for API key:
const API_CONFIG = {
  key: 'your_secured_api_key',
  restrictions: ['Maps JavaScript API', 'Geocoding API'],
  domains: ['yourdomain.com']
};
Code language: JavaScript (javascript)
Complete Implementation Code
html
<!DOCTYPE html>
<html>
<head>
<title>Plot Multiple Points on Map</title>
<meta name="viewport" content="width=device-width, initial-scale=1.0">
<style>
* {
margin: 0;
padding: 0;
box-sizing: border-box;
}
body {
font-family: 'Inter', -apple-system, BlinkMacSystemFont, sans-serif;
background: linear-gradient(135deg, #667eea 0%, #764ba2 100%);
min-height: 100vh;
padding: 20px;
}
.container {
max-width: 1400px;
margin: 0 auto;
background: white;
border-radius: 20px;
box-shadow: 0 20px 40px rgba(0,0,0,0.1);
overflow: hidden;
}
.header {
background: linear-gradient(135deg, #2c3e50, #34495e);
color: white;
padding: 30px;
text-align: center;
}
.header h1 {
font-size: 2.5rem;
margin-bottom: 10px;
font-weight: 700;
}
.header p {
font-size: 1.2rem;
opacity: 0.9;
}
.controls-panel {
background: #f8f9fa;
padding: 25px;
border-bottom: 1px solid #e9ecef;
}
.input-group {
display: grid;
grid-template-columns: 1fr 1fr auto;
gap: 15px;
margin-bottom: 20px;
}
@media (max-width: 768px) {
.input-group {
grid-template-columns: 1fr;
}
}
.input-field {
padding: 12px 15px;
border: 2px solid #e9ecef;
border-radius: 10px;
font-size: 16px;
transition: all 0.3s;
}
.input-field:focus {
outline: none;
border-color: #3498db;
box-shadow: 0 0 0 3px rgba(52, 152, 219, 0.1);
}
.btn {
padding: 12px 25px;
border: none;
border-radius: 10px;
font-size: 16px;
font-weight: 600;
cursor: pointer;
transition: all 0.3s;
}
.btn-primary {
background: #3498db;
color: white;
}
.btn-primary:hover {
background: #2980b9;
transform: translateY(-2px);
}
.btn-secondary {
background: #95a5a6;
color: white;
}
.btn-secondary:hover {
background: #7f8c8d;
}
.btn-danger {
background: #e74c3c;
color: white;
}
.btn-danger:hover {
background: #c0392b;
}
.action-buttons {
display: flex;
gap: 10px;
flex-wrap: wrap;
}
.map-container {
position: relative;
height: 600px;
}
#map {
height: 100%;
width: 100%;
}
.points-list {
position: absolute;
top: 20px;
right: 20px;
width: 300px;
max-height: 500px;
background: white;
border-radius: 10px;
box-shadow: 0 10px 30px rgba(0,0,0,0.2);
overflow-y: auto;
z-index: 1000;
}
.points-list-header {
padding: 15px 20px;
background: #2c3e50;
color: white;
border-radius: 10px 10px 0 0;
font-weight: 600;
}
.point-item {
padding: 15px 20px;
border-bottom: 1px solid #ecf0f1;
cursor: pointer;
transition: background 0.3s;
}
.point-item:hover {
background: #f8f9fa;
}
.point-item:last-child {
border-bottom: none;
}
.point-name {
font-weight: 600;
margin-bottom: 5px;
color: #2c3e50;
}
.point-coords {
font-size: 12px;
color: #7f8c8d;
font-family: 'Courier New', monospace;
}
.stats-bar {
background: #34495e;
color: white;
padding: 15px 25px;
display: flex;
justify-content: space-between;
align-items: center;
}
.export-options {
display: flex;
gap: 10px;
}
.btn-outline {
background: transparent;
border: 2px solid white;
color: white;
}
.btn-outline:hover {
background: white;
color: #34495e;
}
/* Custom marker animation */
@keyframes bounce {
0%, 100% { transform: translateY(0); }
50% { transform: translateY(-10px); }
}
.bouncing-marker {
animation: bounce 1s infinite;
}
</style>
</head>
<body>
<div class="container">
<div class="header">
<h1>📍 Plot Multiple Points</h1>
<p>Add custom locations using addresses or coordinates</p>
</div>
<div class="controls-panel">
<div class="input-group">
<input type="text" id="pointName" class="input-field" placeholder="Point name (e.g., Meeting Point)">
<input type="text" id="pointAddress" class="input-field" placeholder="Address or coordinates (lat,lng)">
<button id="addPointBtn" class="btn btn-primary">Add Point</button>
</div>
<div class="action-buttons">
<button id="clearPointsBtn" class="btn btn-danger">Clear All Points</button>
<button id="importCSVBtn" class="btn btn-secondary">Import CSV</button>
<button id="exportJSONBtn" class="btn btn-secondary">Export JSON</button>
<button id="clusterToggle" class="btn btn-secondary">Toggle Clustering</button>
</div>
</div>
<div class="map-container">
<div id="map"></div>
<div class="points-list" id="pointsList">
<div class="points-list-header">
Points (0)
</div>
<!-- Points will be added here dynamically -->
</div>
</div>
<div class="stats-bar">
<div id="statsInfo">No points added yet</div>
<div class="export-options">
<button id="shareMapBtn" class="btn btn-outline">Share Map</button>
<button id="printMapBtn" class="btn btn-outline">Print Map</button>
</div>
</div>
</div>
<!-- Google Maps API -->
<script src="https://maps.googleapis.com/maps/api/js?key=YOUR_API_KEY&callback=initMap" async defer></script>
<!-- Marker Clusterer -->
<script src="https://unpkg.com/@googlemaps/markerclusterer/dist/index.min.js"></script>
<script>
// Global variables
let map;
let markers = [];
let infoWindow;
let markerCluster;
let isClusteringEnabled = true;
// Points data storage
let pointsData = [];
function initMap() {
// Initialize the map with custom style
map = new google.maps.Map(document.getElementById('map'), {
zoom: 10,
center: { lat: 40.7128, lng: -74.0060 }, // New York
styles: [
{
"featureType": "all",
"elementType": "geometry",
"stylers": [{"color": "#f5f5f5"}]
},
{
"featureType": "water",
"elementType": "geometry",
"stylers": [{"color": "#c5e6ff"}]
}
],
mapTypeControl: true,
streetViewControl: true,
fullscreenControl: true
});
infoWindow = new google.maps.InfoWindow();
// Initialize marker clusterer
markerCluster = new markerClusterer.MarkerClusterer({
map,
markers: [],
renderer: {
render: ({ count, position }) => new google.maps.Marker({
label: { text: String(count), color: "white", fontSize: "12px" },
position,
icon: {
path: google.maps.SymbolPath.CIRCLE,
scale: 25,
fillColor: "#e74c3c",
fillOpacity: 0.9,
strokeWeight: 2,
strokeColor: "#ffffff"
},
zIndex: Number(google.maps.Marker.MAX_ZINDEX) + count
})
}
});
// Set up event listeners
setupEventListeners();
// Load sample data or previously saved points
loadSampleData();
}
function setupEventListeners() {
// Add point button
document.getElementById('addPointBtn').addEventListener('click', addPointFromInput);
// Enter key in address field
document.getElementById('pointAddress').addEventListener('keypress', (e) => {
if (e.key === 'Enter') addPointFromInput();
});
// Clear points button
document.getElementById('clearPointsBtn').addEventListener('click', clearAllPoints);
// Import CSV button
document.getElementById('importCSVBtn').addEventListener('click', importCSV);
// Export JSON button
document.getElementById('exportJSONBtn').addEventListener('click', exportToJSON);
// Cluster toggle
document.getElementById('clusterToggle').addEventListener('click', toggleClustering);
// Share map button
document.getElementById('shareMapBtn').addEventListener('click', shareMap);
// Print map button
document.getElementById('printMapBtn').addEventListener('click', printMap);
// Map click to add point
map.addListener('click', (event) => {
const name = prompt('Enter point name:');
if (name) {
addPoint({
name: name,
position: event.latLng,
address: `Custom point at ${event.latLng.lat().toFixed(6)}, ${event.latLng.lng().toFixed(6)}`
});
}
});
}
function addPointFromInput() {
const nameInput = document.getElementById('pointName');
const addressInput = document.getElementById('pointAddress');
const name = nameInput.value.trim();
const address = addressInput.value.trim();
if (!name || !address) {
alert('Please enter both point name and address/coordinates');
return;
}
// Check if input is coordinates (lat,lng)
const coordMatch = address.match(/^(-?\d+\.?\d*),\s*(-?\d+\.?\d*)$/);
if (coordMatch) {
// Input is coordinates
const lat = parseFloat(coordMatch[1]);
const lng = parseFloat(coordMatch[2]);
addPoint({
name: name,
position: { lat, lng },
address: `Coordinates: ${lat}, ${lng}`
});
} else {
// Input is address - need to geocode
geocodeAddress(address, (position) => {
if (position) {
addPoint({
name: name,
position: position,
address: address
});
} else {
alert('Could not find the address. Please check and try again.');
}
});
}
// Clear inputs
nameInput.value = '';
addressInput.value = '';
nameInput.focus();
}
function geocodeAddress(address, callback) {
const geocoder = new google.maps.Geocoder();
geocoder.geocode({ address: address }, (results, status) => {
if (status === 'OK' && results[0]) {
callback(results[0].geometry.location);
} else {
console.error('Geocode failed:', status);
callback(null);
}
});
}
function addPoint(pointData) {
const pointId = Date.now(); // Simple unique ID
const point = {
id: pointId,
name: pointData.name,
position: pointData.position,
address: pointData.address,
timestamp: new Date().toISOString()
};
// Add to data array
pointsData.push(point);
// Create marker
const marker = new google.maps.Marker({
position: point.position,
map: map,
title: point.name,
icon: {
url: 'https://maps.google.com/mapfiles/ms/icons/red-dot.png',
scaledSize: new google.maps.Size(32, 32)
},
animation: google.maps.Animation.DROP
});
// Store marker reference
point.marker = marker;
markers.push(marker);
// Add click listener
marker.addListener('click', () => {
showPointInfo(marker, point);
});
// Update clustering
if (isClusteringEnabled) {
markerCluster.addMarker(marker);
}
// Update points list
updatePointsList();
// Update stats
updateStats();
// Fit map to show all points
fitMapToPoints();
// Save to localStorage
savePointsToStorage();
}
function showPointInfo(marker, point) {
const content = `
<div style="padding: 20px; max-width: 300px;">
<h3 style="margin: 0 0 10px 0; color: #2c3e50; border-bottom: 2px solid #3498db; padding-bottom: 5px;">
${point.name}
</h3>
<div style="margin-bottom: 10px;">
<strong>📍 Location:</strong><br>
<span style="color: #666;">${point.address}</span>
</div>
<div style="margin-bottom: 10px;">
<strong>📐 Coordinates:</strong><br>
<code style="color: #666; font-size: 12px;">
${point.position.lat().toFixed(6)}, ${point.position.lng().toFixed(6)}
</code>
</div>
<div style="margin-bottom: 15px;">
<strong>🕒 Added:</strong><br>
<span style="color: #666; font-size: 12px;">
${new Date(point.timestamp).toLocaleString()}
</span>
</div>
<div style="text-align: center;">
<button onclick="navigateToPoint(${point.position.lat()}, ${point.position.lng()})"
style="background: #3498db; color: white; border: none; padding: 10px 20px;
border-radius: 5px; cursor: pointer; font-size: 14px;">
Get Directions
</button>
<button onclick="removePoint(${point.id})"
style="background: #e74c3c; color: white; border: none; padding: 10px 20px;
border-radius: 5px; cursor: pointer; font-size: 14px; margin-left: 10px;">
Remove
</button>
</div>
</div>
`;
infoWindow.setContent(content);
infoWindow.open(map, marker);
}
function updatePointsList() {
const pointsList = document.getElementById('pointsList');
const header = pointsList.querySelector('.points-list-header');
header.textContent = `Points (${pointsData.length})`;
// Clear existing list items (except header)
const existingItems = pointsList.querySelectorAll('.point-item');
existingItems.forEach(item => item.remove());
// Add points to list
pointsData.forEach(point => {
const pointItem = document.createElement('div');
pointItem.className = 'point-item';
pointItem.innerHTML = `
<div class="point-name">${point.name}</div>
<div class="point-coords">
${point.position.lat().toFixed(4)}, ${point.position.lng().toFixed(4)}
</div>
`;
pointItem.addEventListener('click', () => {
map.panTo(point.position);
map.setZoom(15);
showPointInfo(point.marker, point);
});
pointsList.appendChild(pointItem);
});
}
function updateStats() {
const statsElement = document.getElementById('statsInfo');
if (pointsData.length === 0) {
statsElement.textContent = 'No points added yet';
} else {
const bounds = getPointsBounds();
const area = calculateCoverageArea(bounds);
statsElement.textContent =
`${pointsData.length} points | Coverage: ${area} km² | Clustering: ${isClusteringEnabled ? 'ON' : 'OFF'}`;
}
}
function getPointsBounds() {
const bounds = new google.maps.LatLngBounds();
pointsData.forEach(point => {
bounds.extend(point.position);
});
return bounds;
}
function calculateCoverageArea(bounds) {
if (!bounds || bounds.isEmpty()) return 0;
const ne = bounds.getNorthEast();
const sw = bounds.getSouthWest();
// Simple distance calculation (approximate)
const latDiff = Math.abs(ne.lat() - sw.lat());
const lngDiff = Math.abs(ne.lng() - sw.lng());
// Rough area calculation (in km²)
const area = (latDiff * 110.574) * (lngDiff * 111.320 * Math.cos((ne.lat() + sw.lat()) / 2 * Math.PI / 180));
return Math.round(area * 100) / 100;
}
function fitMapToPoints() {
if (pointsData.length === 0) return;
const bounds = getPointsBounds();
map.fitBounds(bounds);
// Don't zoom in too far if there's only one point
if (pointsData.length === 1 && map.getZoom() > 15) {
map.setZoom(15);
}
}
// Global functions for button callbacks
window.navigateToPoint = function(lat, lng) {
window.open(`https://www.google.com/maps/dir/?api=1&destination=${lat},${lng}`, '_blank');
};
window.removePoint = function(pointId) {
const pointIndex = pointsData.findIndex(p => p.id === pointId);
if (pointIndex !== -1) {
const point = pointsData[pointIndex];
// Remove marker from map and cluster
point.marker.setMap(null);
markerCluster.removeMarker(point.marker);
// Remove from arrays
pointsData.splice(pointIndex, 1);
markers = markers.filter(m => m !== point.marker);
// Update UI
updatePointsList();
updateStats();
savePointsToStorage();
infoWindow.close();
}
};
function clearAllPoints() {
if (!confirm('Are you sure you want to remove all points?')) return;
// Remove all markers
markers.forEach(marker => marker.setMap(null));
markerCluster.clearMarkers();
// Clear data
pointsData = [];
markers = [];
// Update UI
updatePointsList();
updateStats();
savePointsToStorage();
}
function toggleClustering() {
isClusteringEnabled = !isClusteringEnabled;
if (isClusteringEnabled) {
markerCluster.addMarkers(markers);
markers.forEach(marker => marker.setMap(null));
} else {
markerCluster.clearMarkers();
markers.forEach(marker => marker.setMap(map));
}
updateStats();
}
function importCSV() {
const input = document.createElement('input');
input.type = 'file';
input.accept = '.csv';
input.onchange = (e) => {
const file = e.target.files[0];
const reader = new FileReader();
reader.onload = (event) => {
const csv = event.target.result;
parseCSVData(csv);
};
reader.readAsText(file);
};
input.click();
}
function parseCSVData(csvText) {
const lines = csvText.split('\n').filter(line => line.trim());
let importedCount = 0;
for (let i = 1; i < lines.length; i++) { // Skip header
const [name, lat, lng, address] = lines[i].split(',').map(field => field.trim());
if (name && lat && lng) {
addPoint({
name: name,
position: { lat: parseFloat(lat), lng: parseFloat(lng) },
address: address || `Imported: ${name}`
});
importedCount++;
}
}
alert(`Successfully imported ${importedCount} points`);
}
function exportToJSON() {
const exportData = pointsData.map(point => ({
name: point.name,
latitude: point.position.lat(),
longitude: point.position.lng(),
address: point.address,
timestamp: point.timestamp
}));
const dataStr = JSON.stringify(exportData, null, 2);
const dataBlob = new Blob([dataStr], { type: 'application/json' });
const link = document.createElement('a');
link.href = URL.createObjectURL(dataBlob);
link.download = 'map-points-export.json';
link.click();
}
function shareMap() {
const mapData = {
center: map.getCenter().toJSON(),
zoom: map.getZoom(),
points: pointsData.map(point => ({
name: point.name,
position: point.position.toJSON(),
address: point.address
}))
};
const shareableData = btoa(JSON.stringify(mapData));
const shareUrl = `${window.location.origin}${window.location.pathname}?map=${shareableData}`;
// Copy to clipboard
navigator.clipboard.writeText(shareUrl).then(() => {
alert('Map link copied to clipboard! Share this URL with others.');
});
}
function printMap() {
window.print();
}
function savePointsToStorage() {
const saveData = pointsData.map(point => ({
name: point.name,
position: point.position.toJSON(),
address: point.address,
timestamp: point.timestamp
}));
localStorage.setItem('savedMapPoints', JSON.stringify(saveData));
}
function loadPointsFromStorage() {
const saved = localStorage.getItem('savedMapPoints');
if (saved) {
const points = JSON.parse(saved);
points.forEach(point => {
addPoint({
name: point.name,
position: point.position,
address: point.address
});
});
}
}
function loadSampleData() {
// Load sample data if no points exist
if (pointsData.length === 0) {
const samplePoints = [
{
name: "Statue of Liberty",
position: { lat: 40.6892, lng: -74.0445 },
address: "Liberty Island, New York, NY 10004"
},
{
name: "Empire State Building",
position: { lat: 40.7484, lng: -73.9857 },
address: "20 W 34th St, New York, NY 10001"
},
{
name: "Central Park",
position: { lat: 40.7829, lng: -73.9654 },
address: "New York, NY 10024"
}
];
// Add sample points with delay for animation
samplePoints.forEach((point, index) => {
setTimeout(() => {
addPoint(point);
}, index * 500);
});
}
}
</script>
</body>
</html>
Code language: HTML, XML (xml)Advanced Features
Real-time Data Integration
javascript
// Live data feed integration
async function connectToLiveData() {
    const socket = new WebSocket('wss://your-data-feed.com/points');

    socket.onmessage = (event) => {
        const newPoint = JSON.parse(event.data);
        addPoint(newPoint);
    };
}

// GPS tracking integration
function trackUserLocation() {
    if (navigator.geolocation) {
        navigator.geolocation.watchPosition((position) => {
            addPoint({
                name: 'Current Location',
                position: {
                    lat: position.coords.latitude,
                    lng: position.coords.longitude
                },
                address: 'GPS Tracked Location'
            });
        });
    }
}
Code language: JavaScript (javascript)
Batch Operations
javascript
// Add multiple points at once
function addMultiplePoints(pointsArray) {
    pointsArray.forEach((point, index) => {
        setTimeout(() => addPoint(point), index * 100);
    });
}

// Radius search around point
function findPointsInRadius(centerPoint, radiusKm) {
    return pointsData.filter(point => {
        const distance = calculateDistance(centerPoint, point.position);
        return distance <= radiusKm;
    });
}
Code language: JavaScript (javascript)
Common Challenges & Solutions
Problem: Coordinate Precision
javascript
// High-precision coordinate handling
function validateCoordinates(lat, lng) {
    const isValidLat = lat >= -90 && lat <= 90;
    const isValidLng = lng >= -180 && lng <= 180;
    return isValidLat && isValidLng;
}

// Coordinate conversion utilities
function DMSToDecimal(degrees, minutes, seconds, direction) {
    let decimal = degrees + minutes/60 + seconds/3600;
    if (direction === 'S' || direction === 'W') {
        decimal = -decimal;
    }
    return decimal;
}
Code language: JavaScript (javascript)
Problem: Performance with Thousands of Points
- – Implement marker clustering
- – Use data sampling for very large datasets
- – Implement virtual scrolling for lists
- – Use Web Workers for heavy calculations
The Professional Alternative: MapsFun.com
While the technical approach provides full control, it comes with significant complexity:
Development Challenges:
- – ⏰ Weeks of development time
- – 💻 Advanced JavaScript expertise required
- – 🐛 Cross-browser compatibility issues
- – 🔧 Ongoing maintenance and security updates
- – 💰 API cost management and optimization
- – 📱 Mobile performance tuning
MapsFun.com Advantages:
- – ✅ 3-minute setup – No coding required
- – ✅ Visual point plotting interface
- – ✅ Automatic clustering and optimization
- – ✅ No API keys or billing management
- – ✅ Professional templates and styles
- – ✅ Real-time collaboration features
- – ✅ Bulk import from spreadsheets and GPS data
- – ✅ Advanced analytics and insights
“As a field researcher, I need to plot hundreds of GPS coordinates daily. MapsFun.com eliminated weeks of development time and gave me a professional tool my whole team can use instantly.” – Dr. Sarah Chen, Research Team Lead
Get Started Today
For developers with specific requirements: Use the Google Maps Platform approach above for complete customization.
For everyone else: Get production-ready point mapping in minutes with MapsFun.com
Why Choose MapsFun.com ?
- – 🚀 Deploy in minutes, not months
- – 🎨 Beautiful, brand-consistent designs
- – 📊 Enterprise features at startup prices
- – 🔧 Zero maintenance overhead
- – 💰 Predictable pricing, no hidden costs
- – 🌐 Global CDN and optimized performance
Start plotting your points for free at MapsFun.com and join thousands of users who’ve simplified their mapping workflows.
Stop wrestling with complex code – start creating beautiful, functional point maps today!